Plotting Perlin Spirals (and not circles)
|
|
* * *
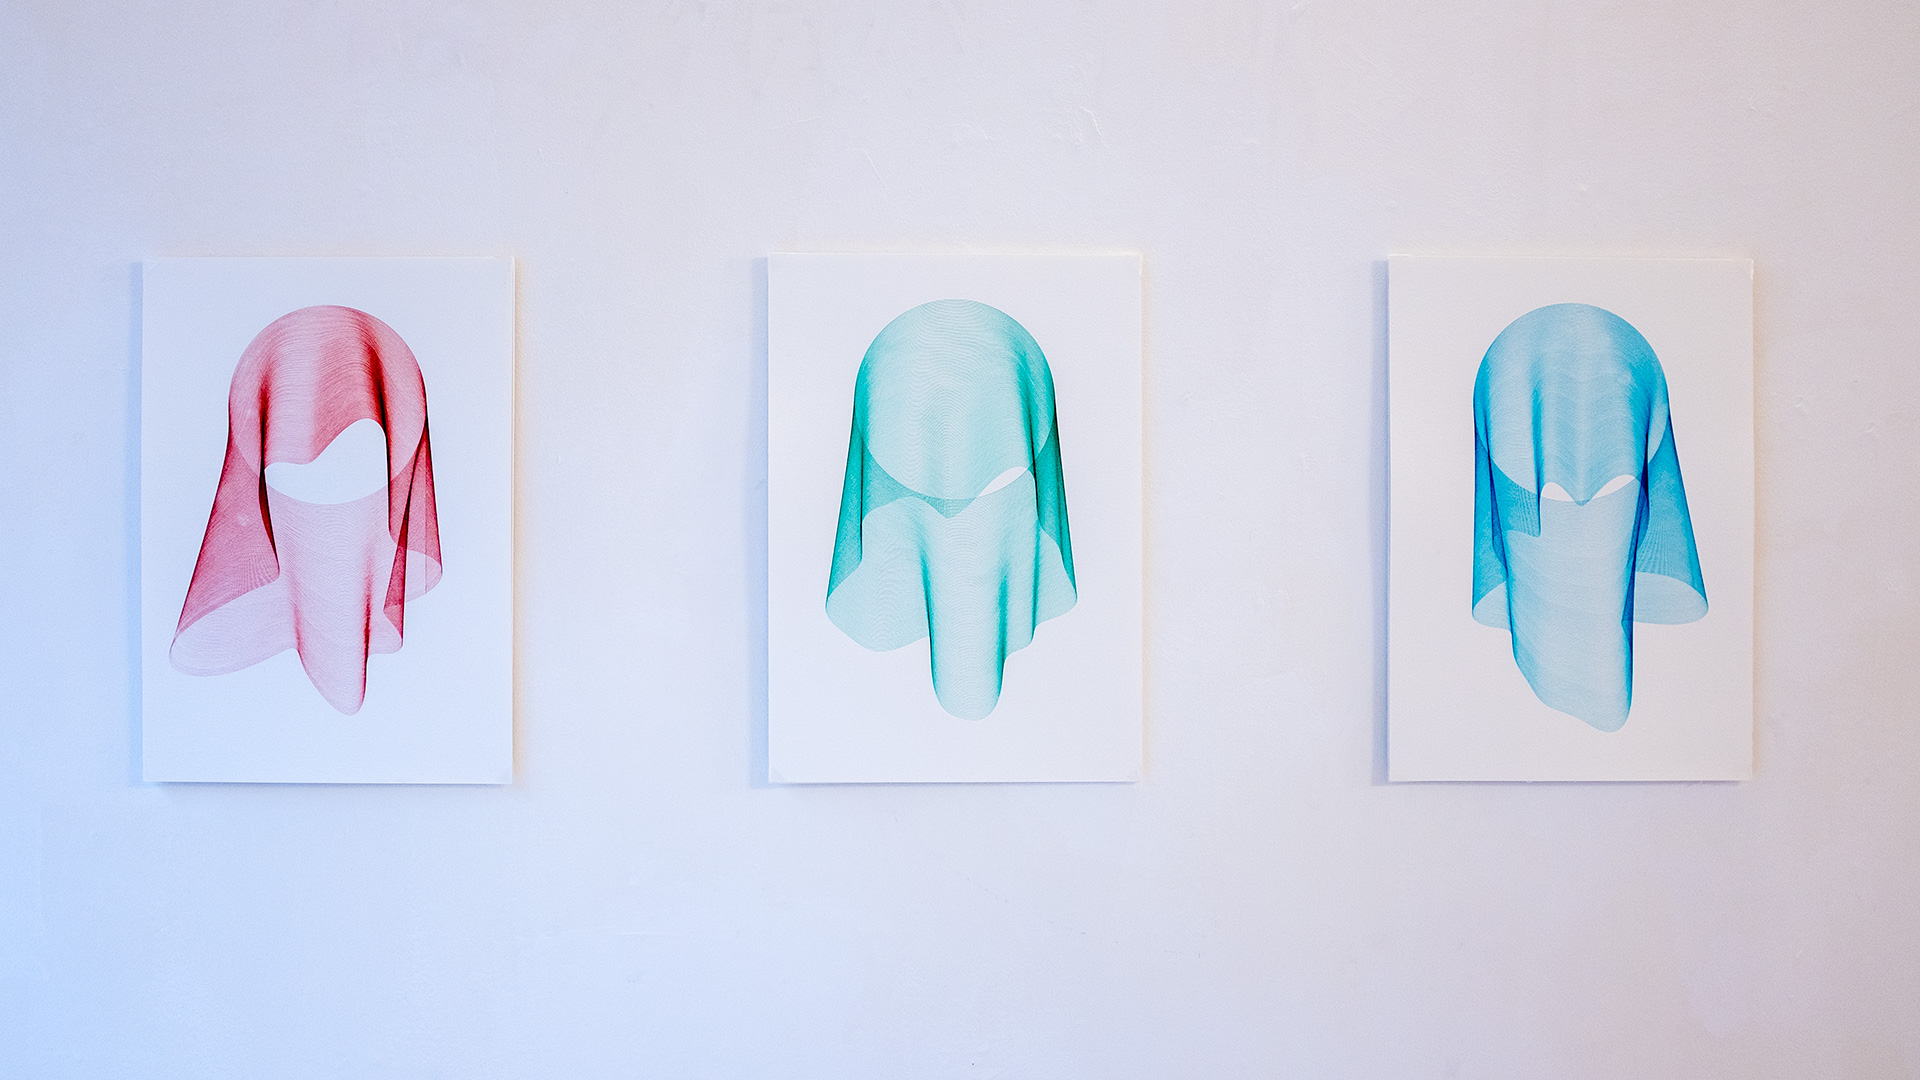
Just before Christmas, I produced a whole bunch of different plots with the AxiDraw. Partly because it was exciting having a new toy to play with and somewhat because I had a sudden unexpected exhibition and I wanted to put a range of different things into it.
Which meant I didn't do what I was planning on doing and writing about what I was doing, as I was doing it. Instead, I just took a bunch of photos as I went along and posted those to Instagram and some to twitter.
So this is my chance to go back and document some of the things, which I'm going to do with one of the more recent ones first, and then go back and do the rest, probably.
Let us get started then with this lot...
* * *
Overview
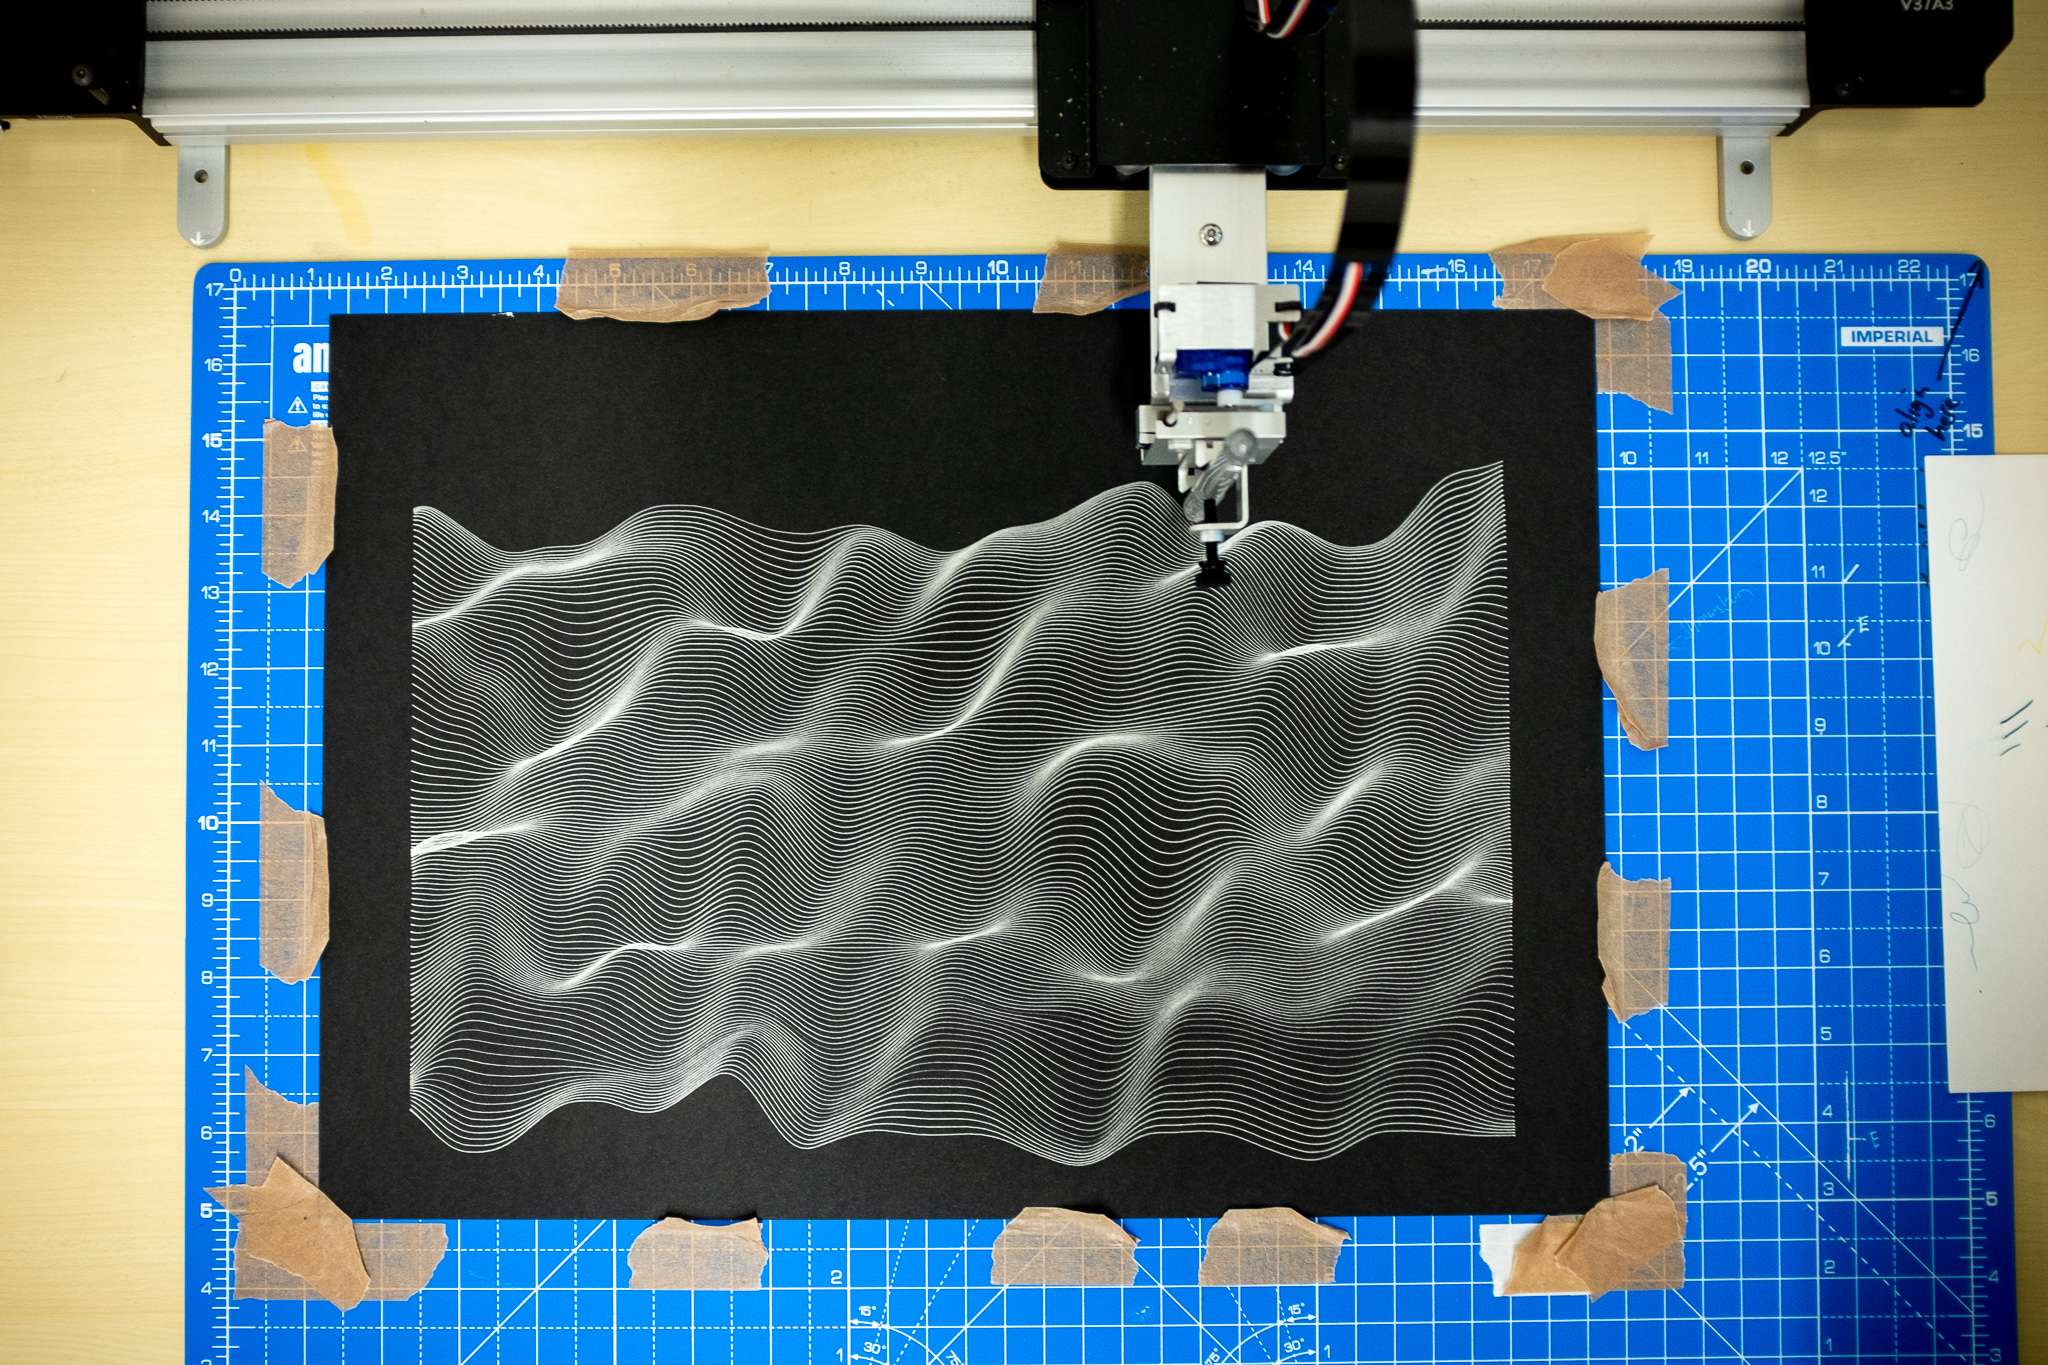
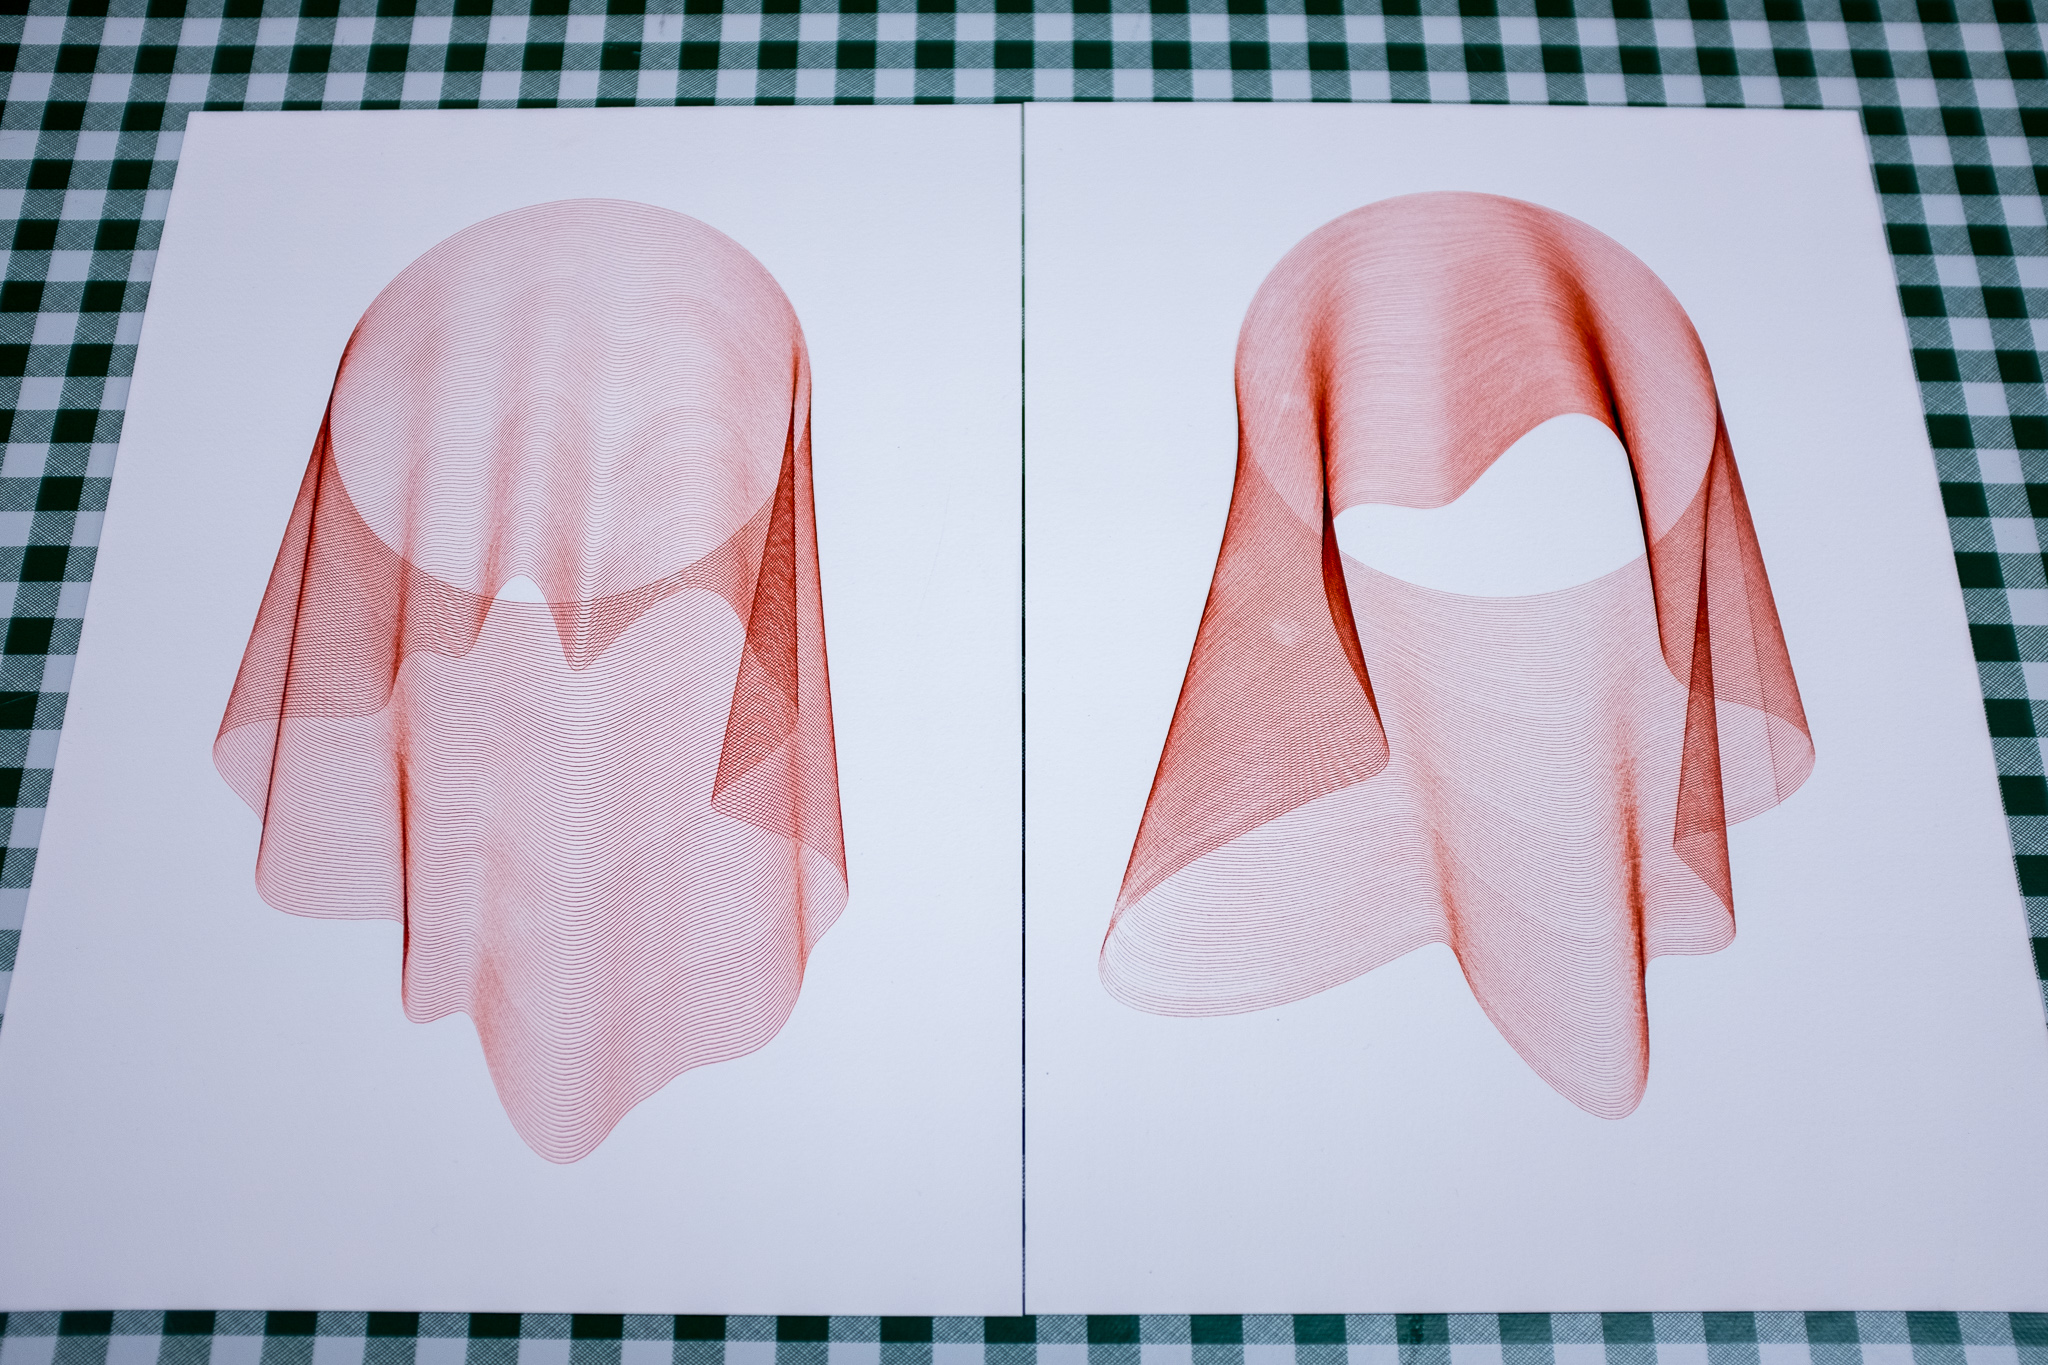
I'd been playing with "Perlin landscapes", shown below on the left, and a little bit of Moiré pattern interference in circles, shown on the right.
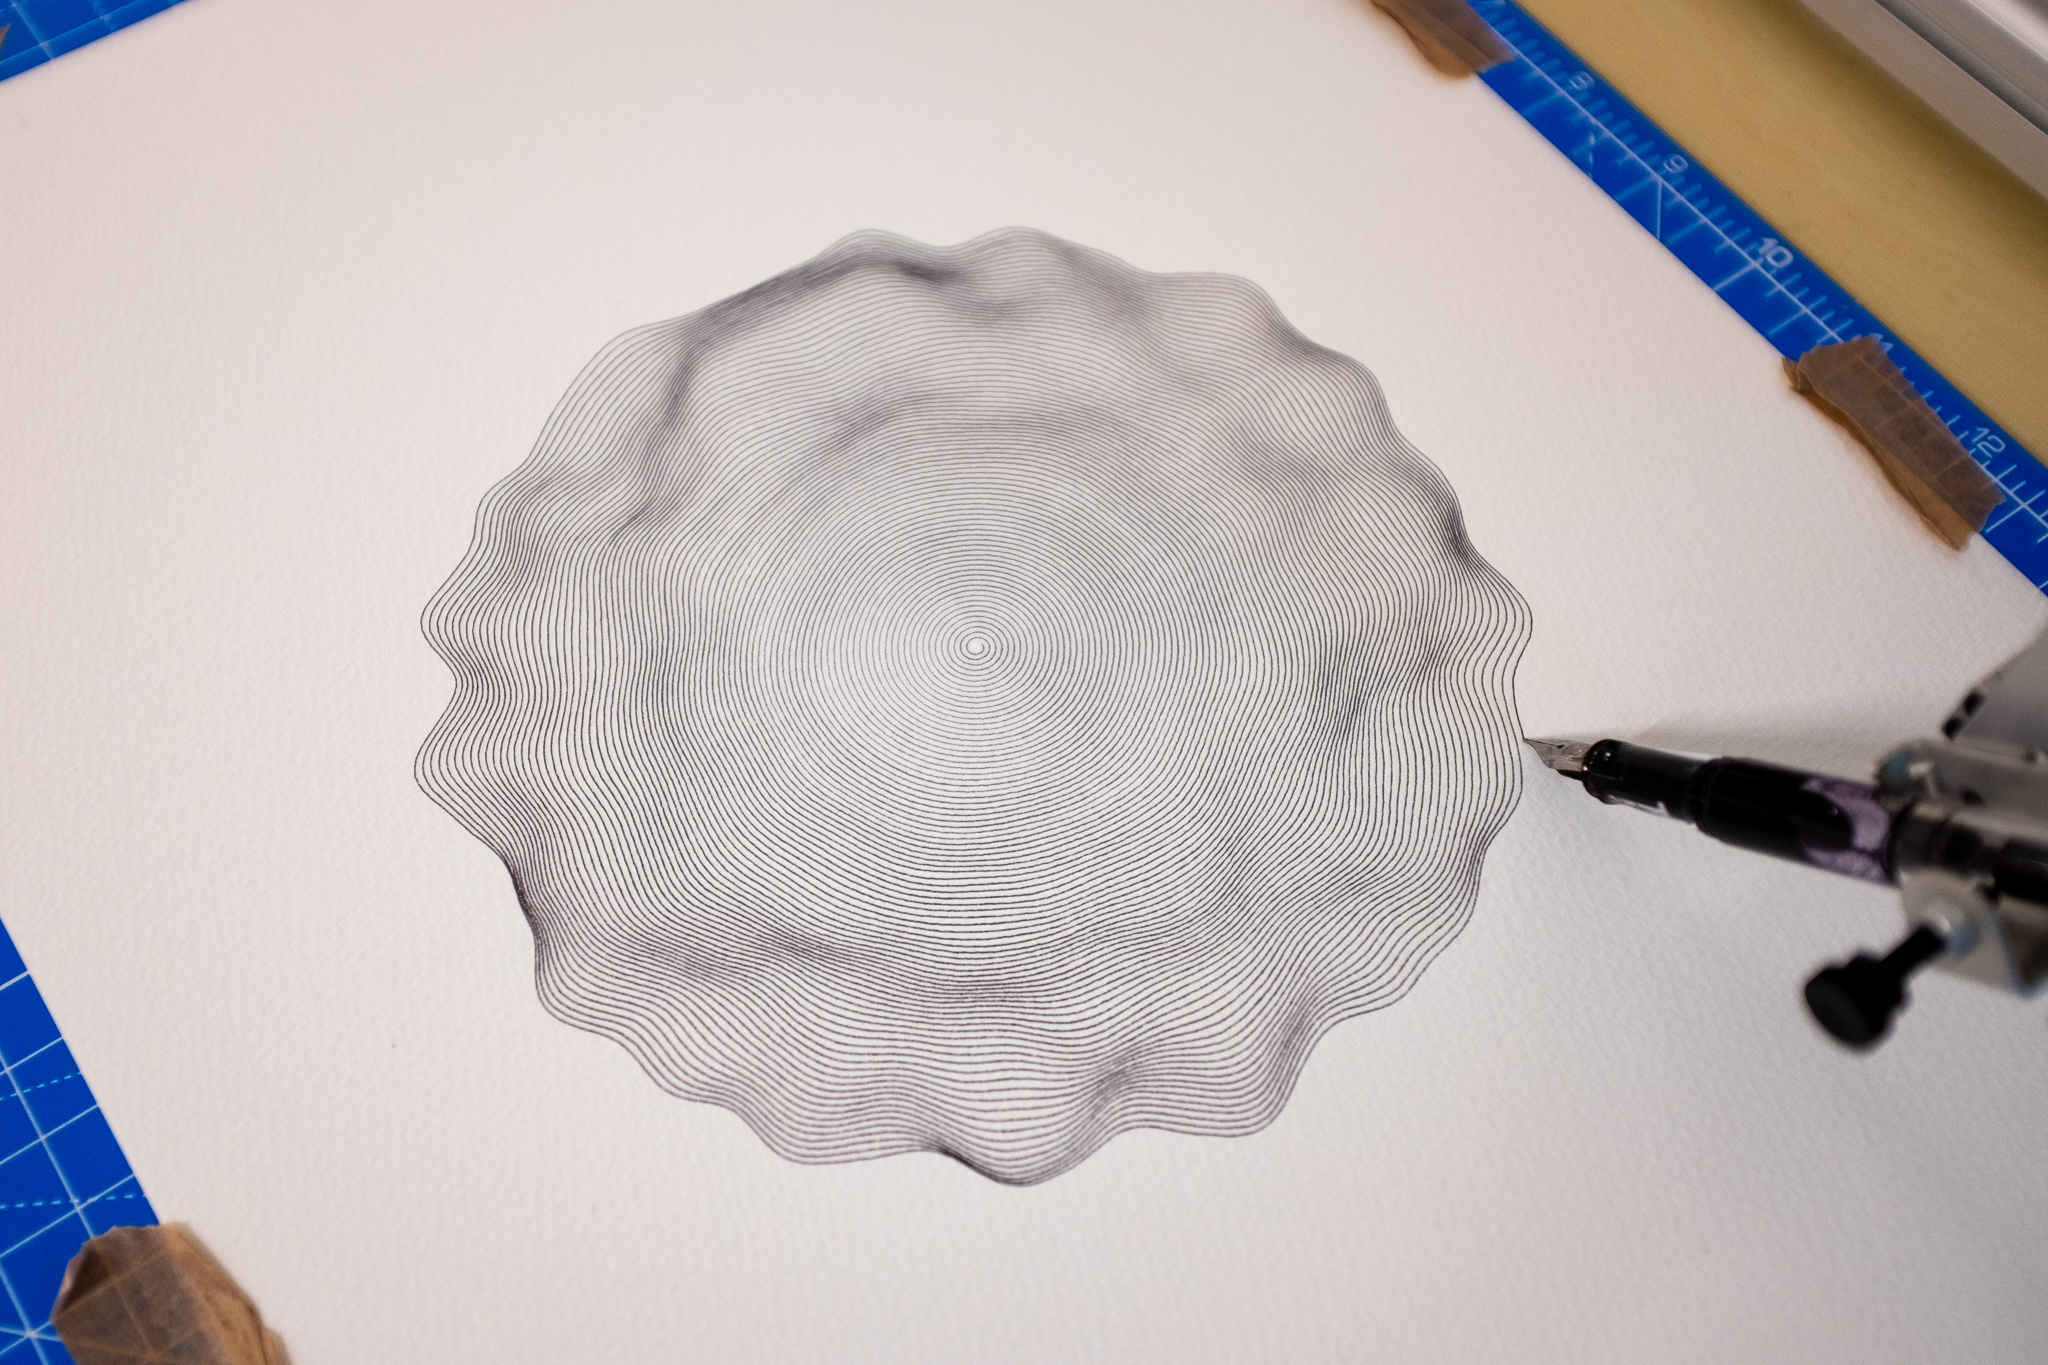
The image on the right was created by offsetting two identical sets of nested circles. But what I decided I wanted instead was to use the Perlin technique from the landscapes to make two differently perturbed sets of rings. Each set would be printed directly over the other.
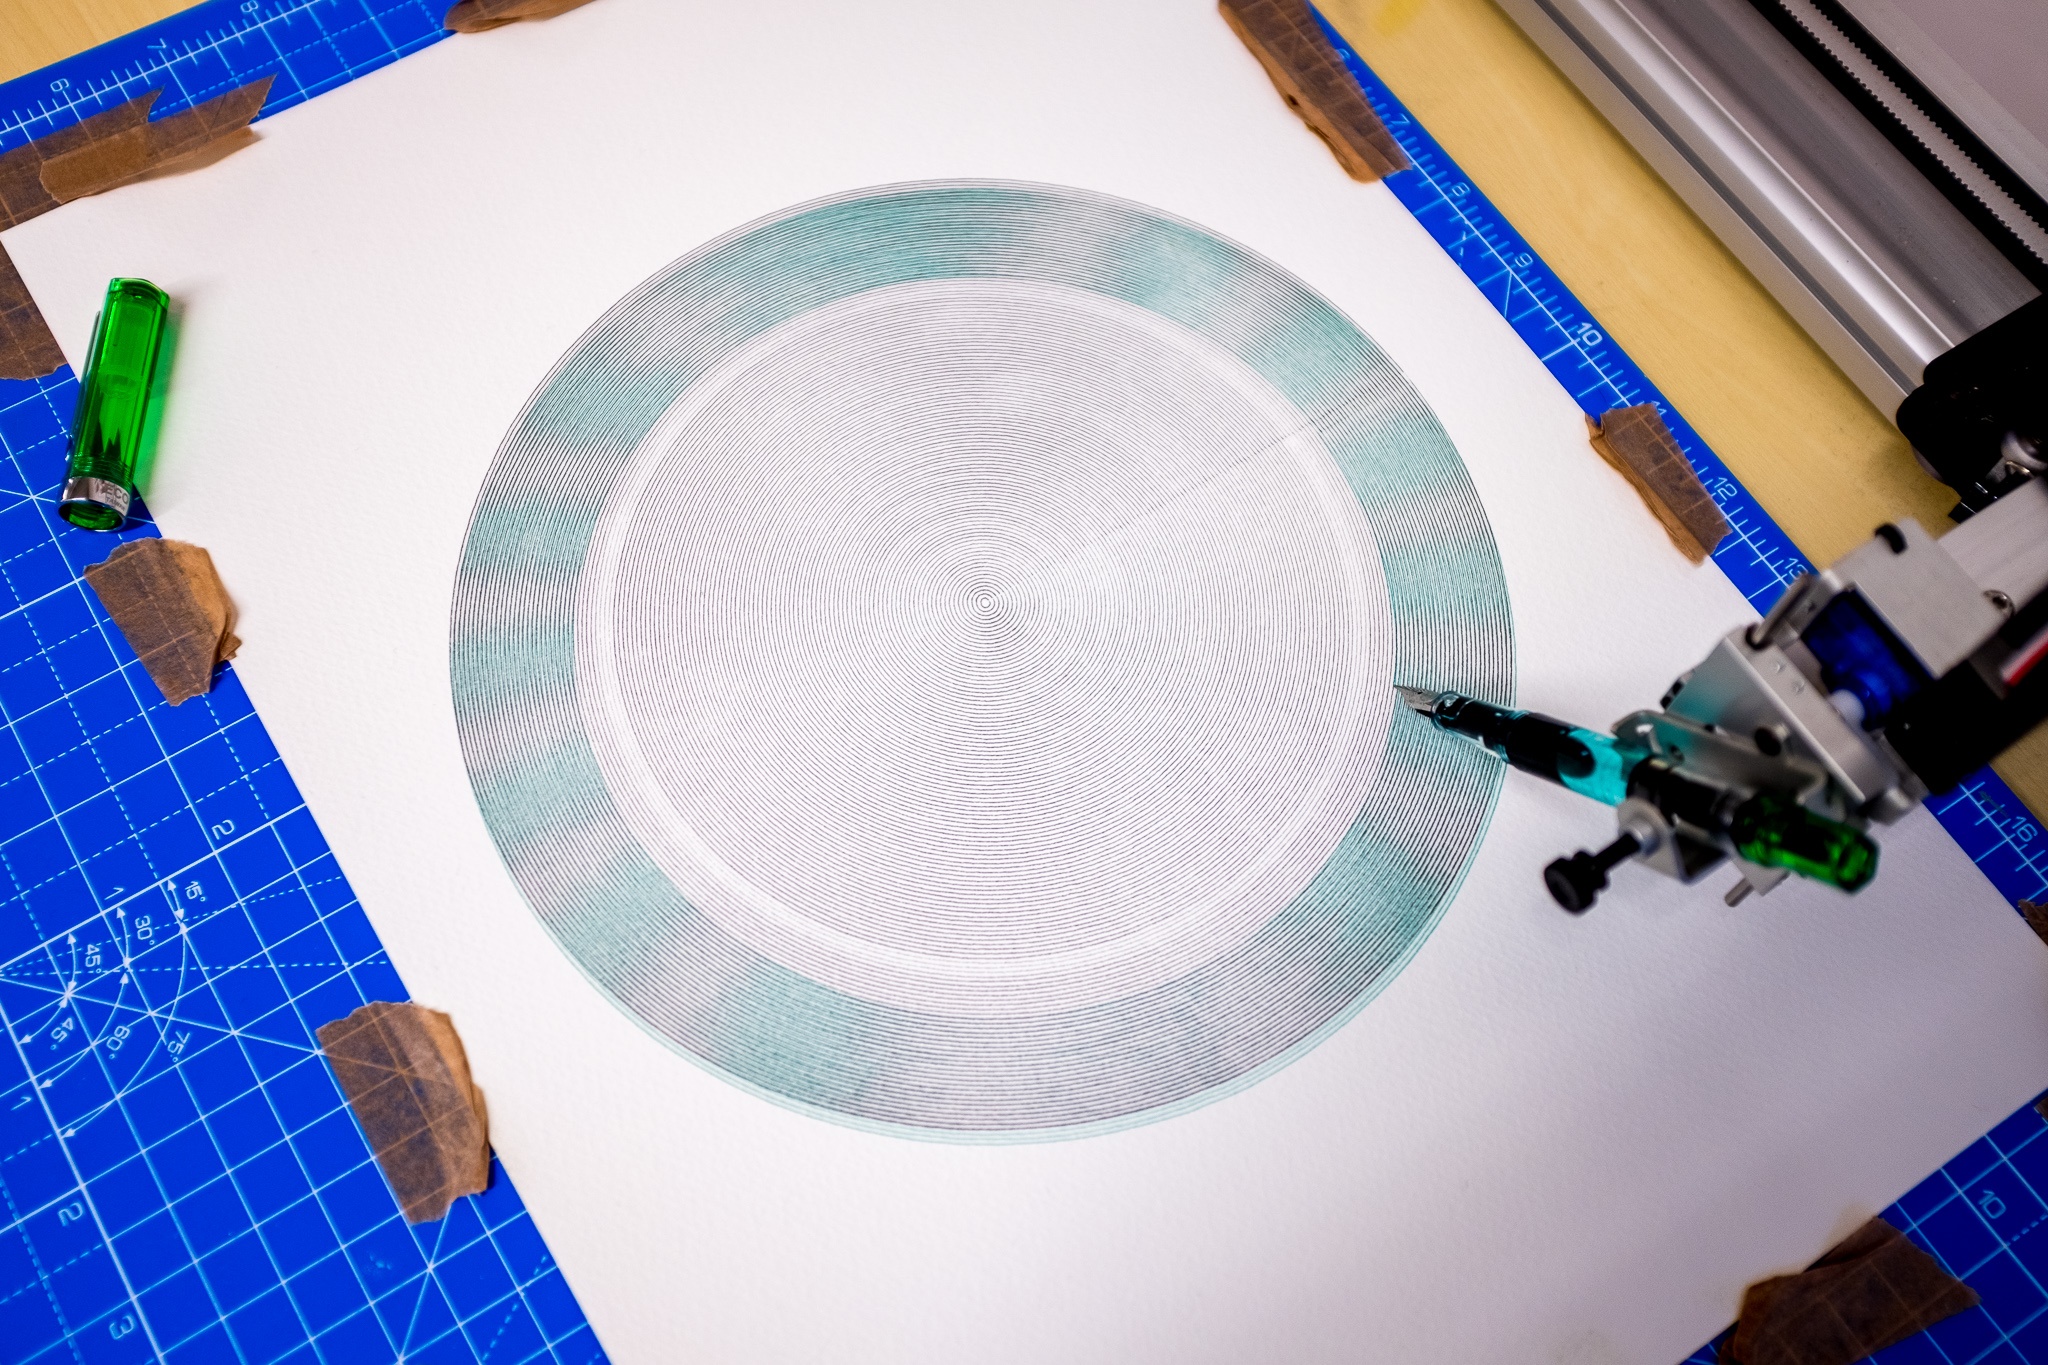
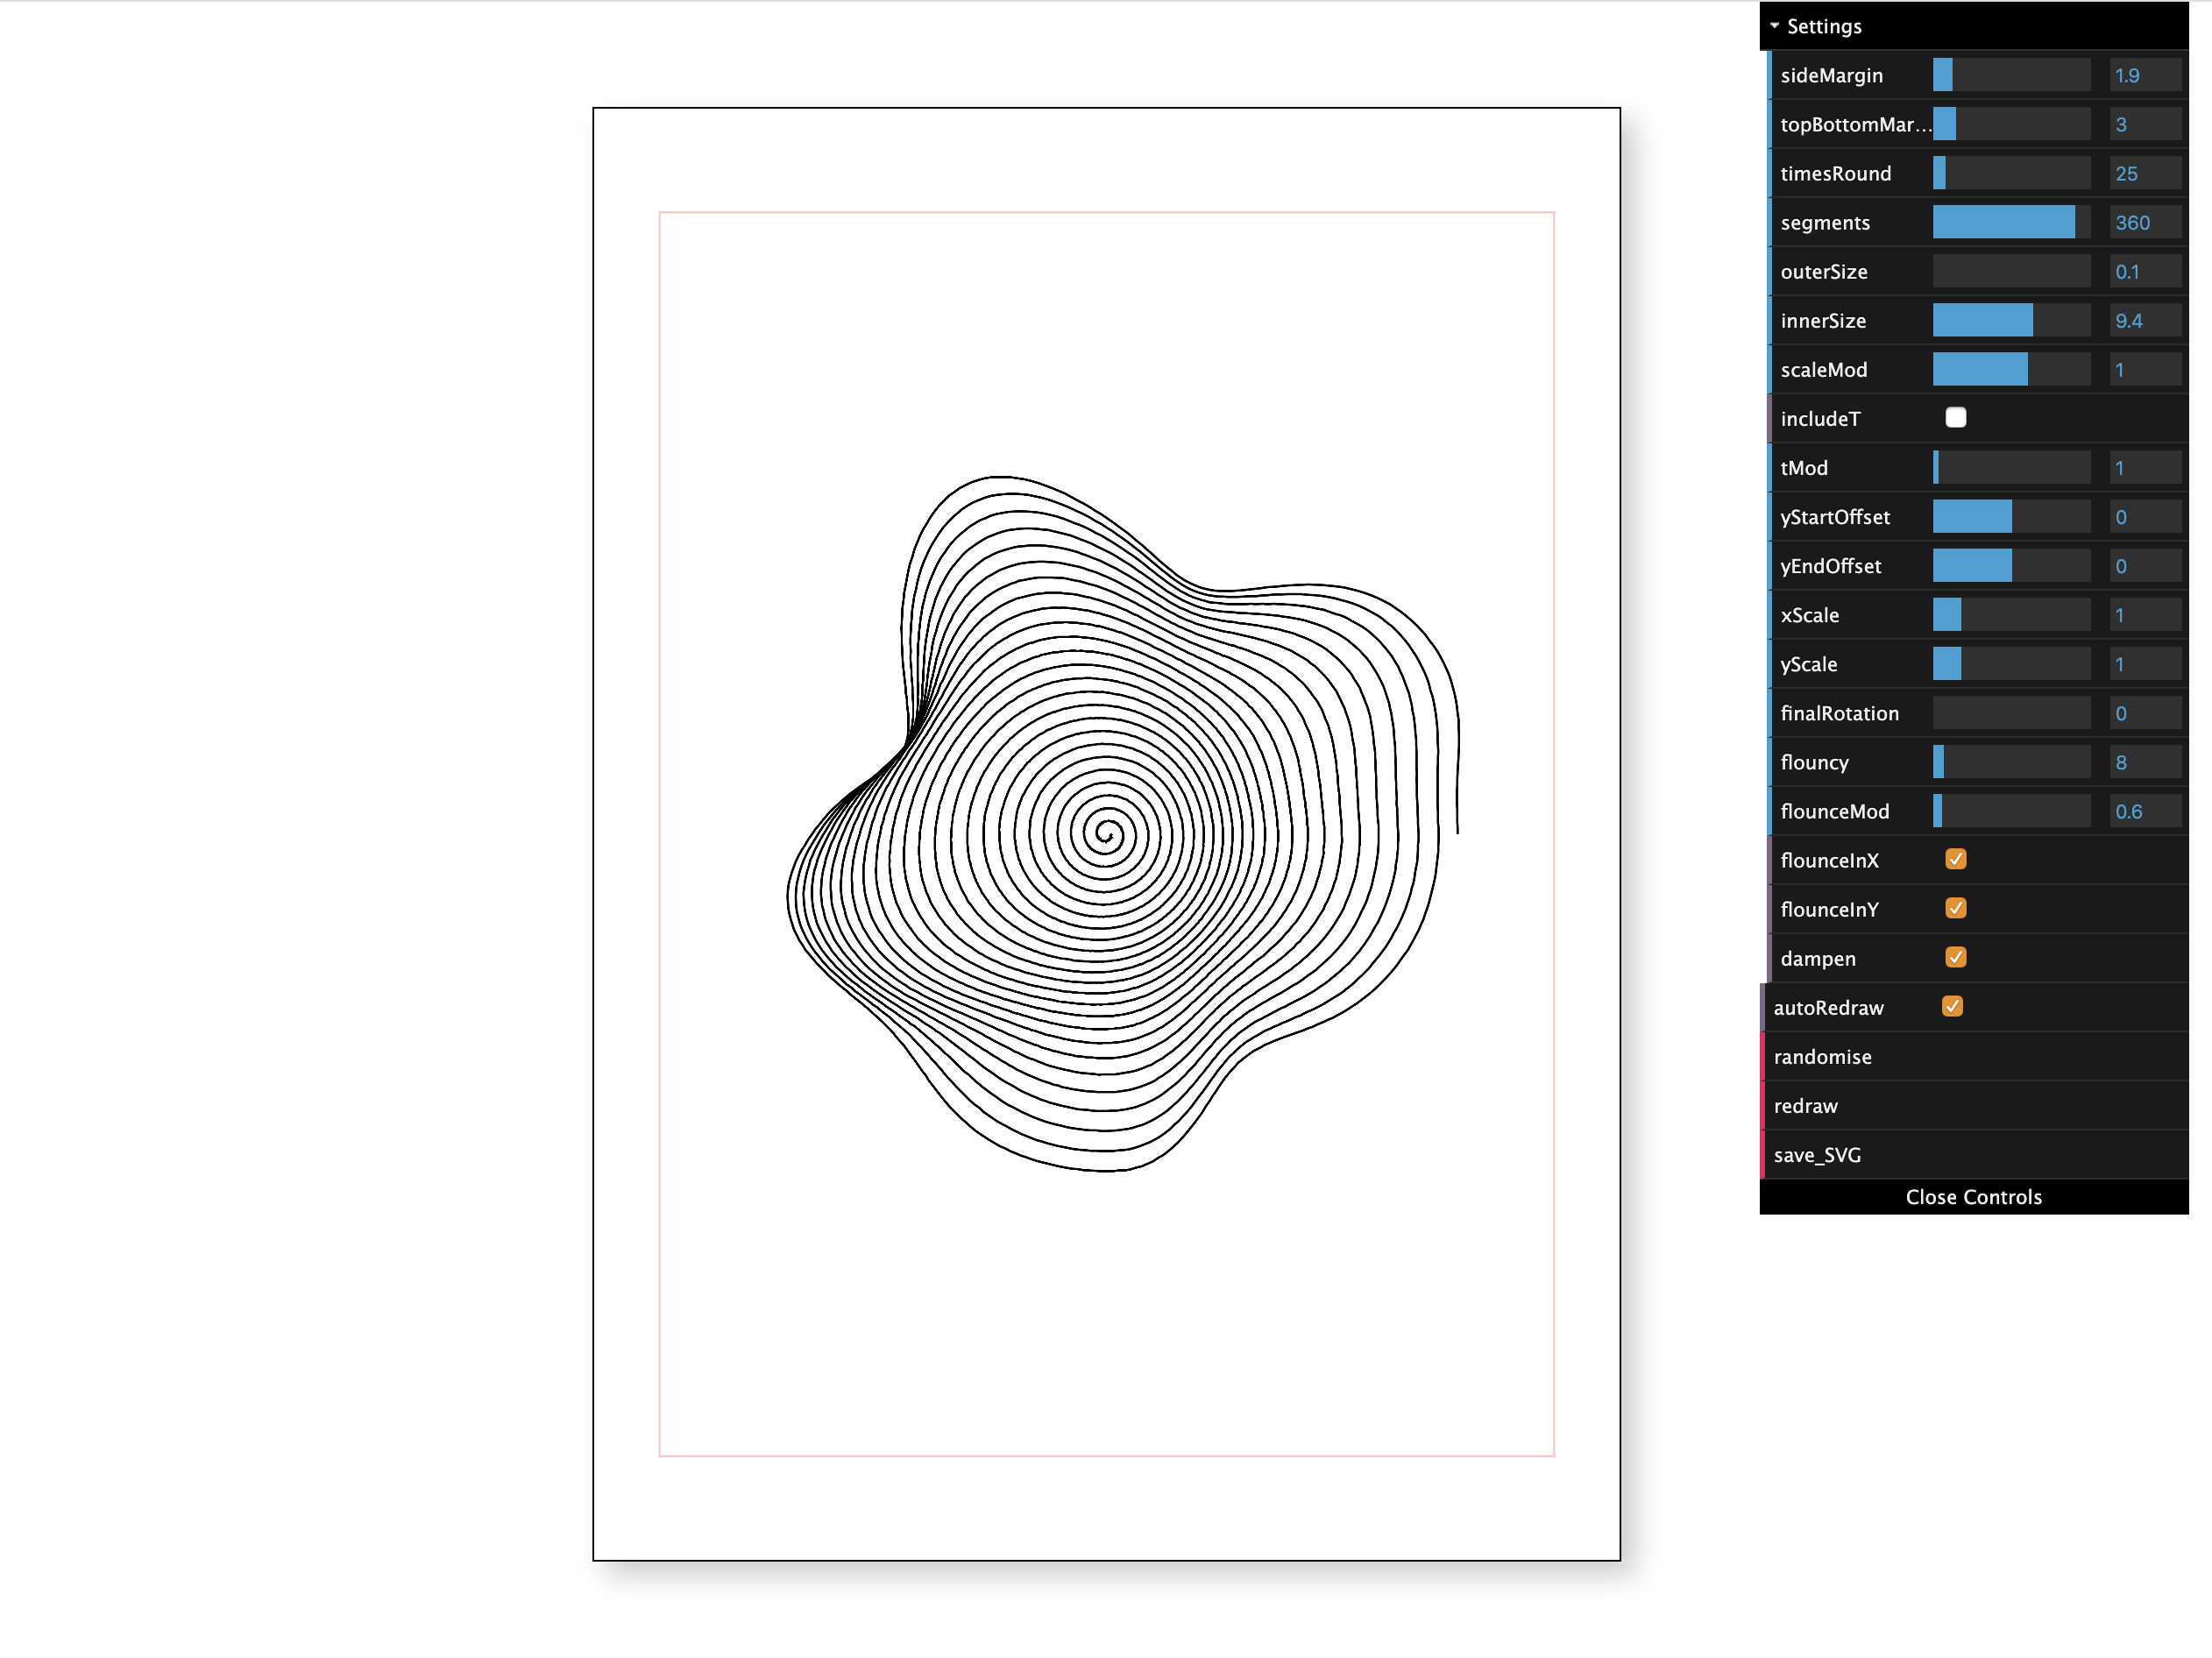
A single set of circles would look something like this (although this is actually a spiral, I'll come back to that).
While three placed on top of each other would look like this (again spirals not circles for reasons, explained below).
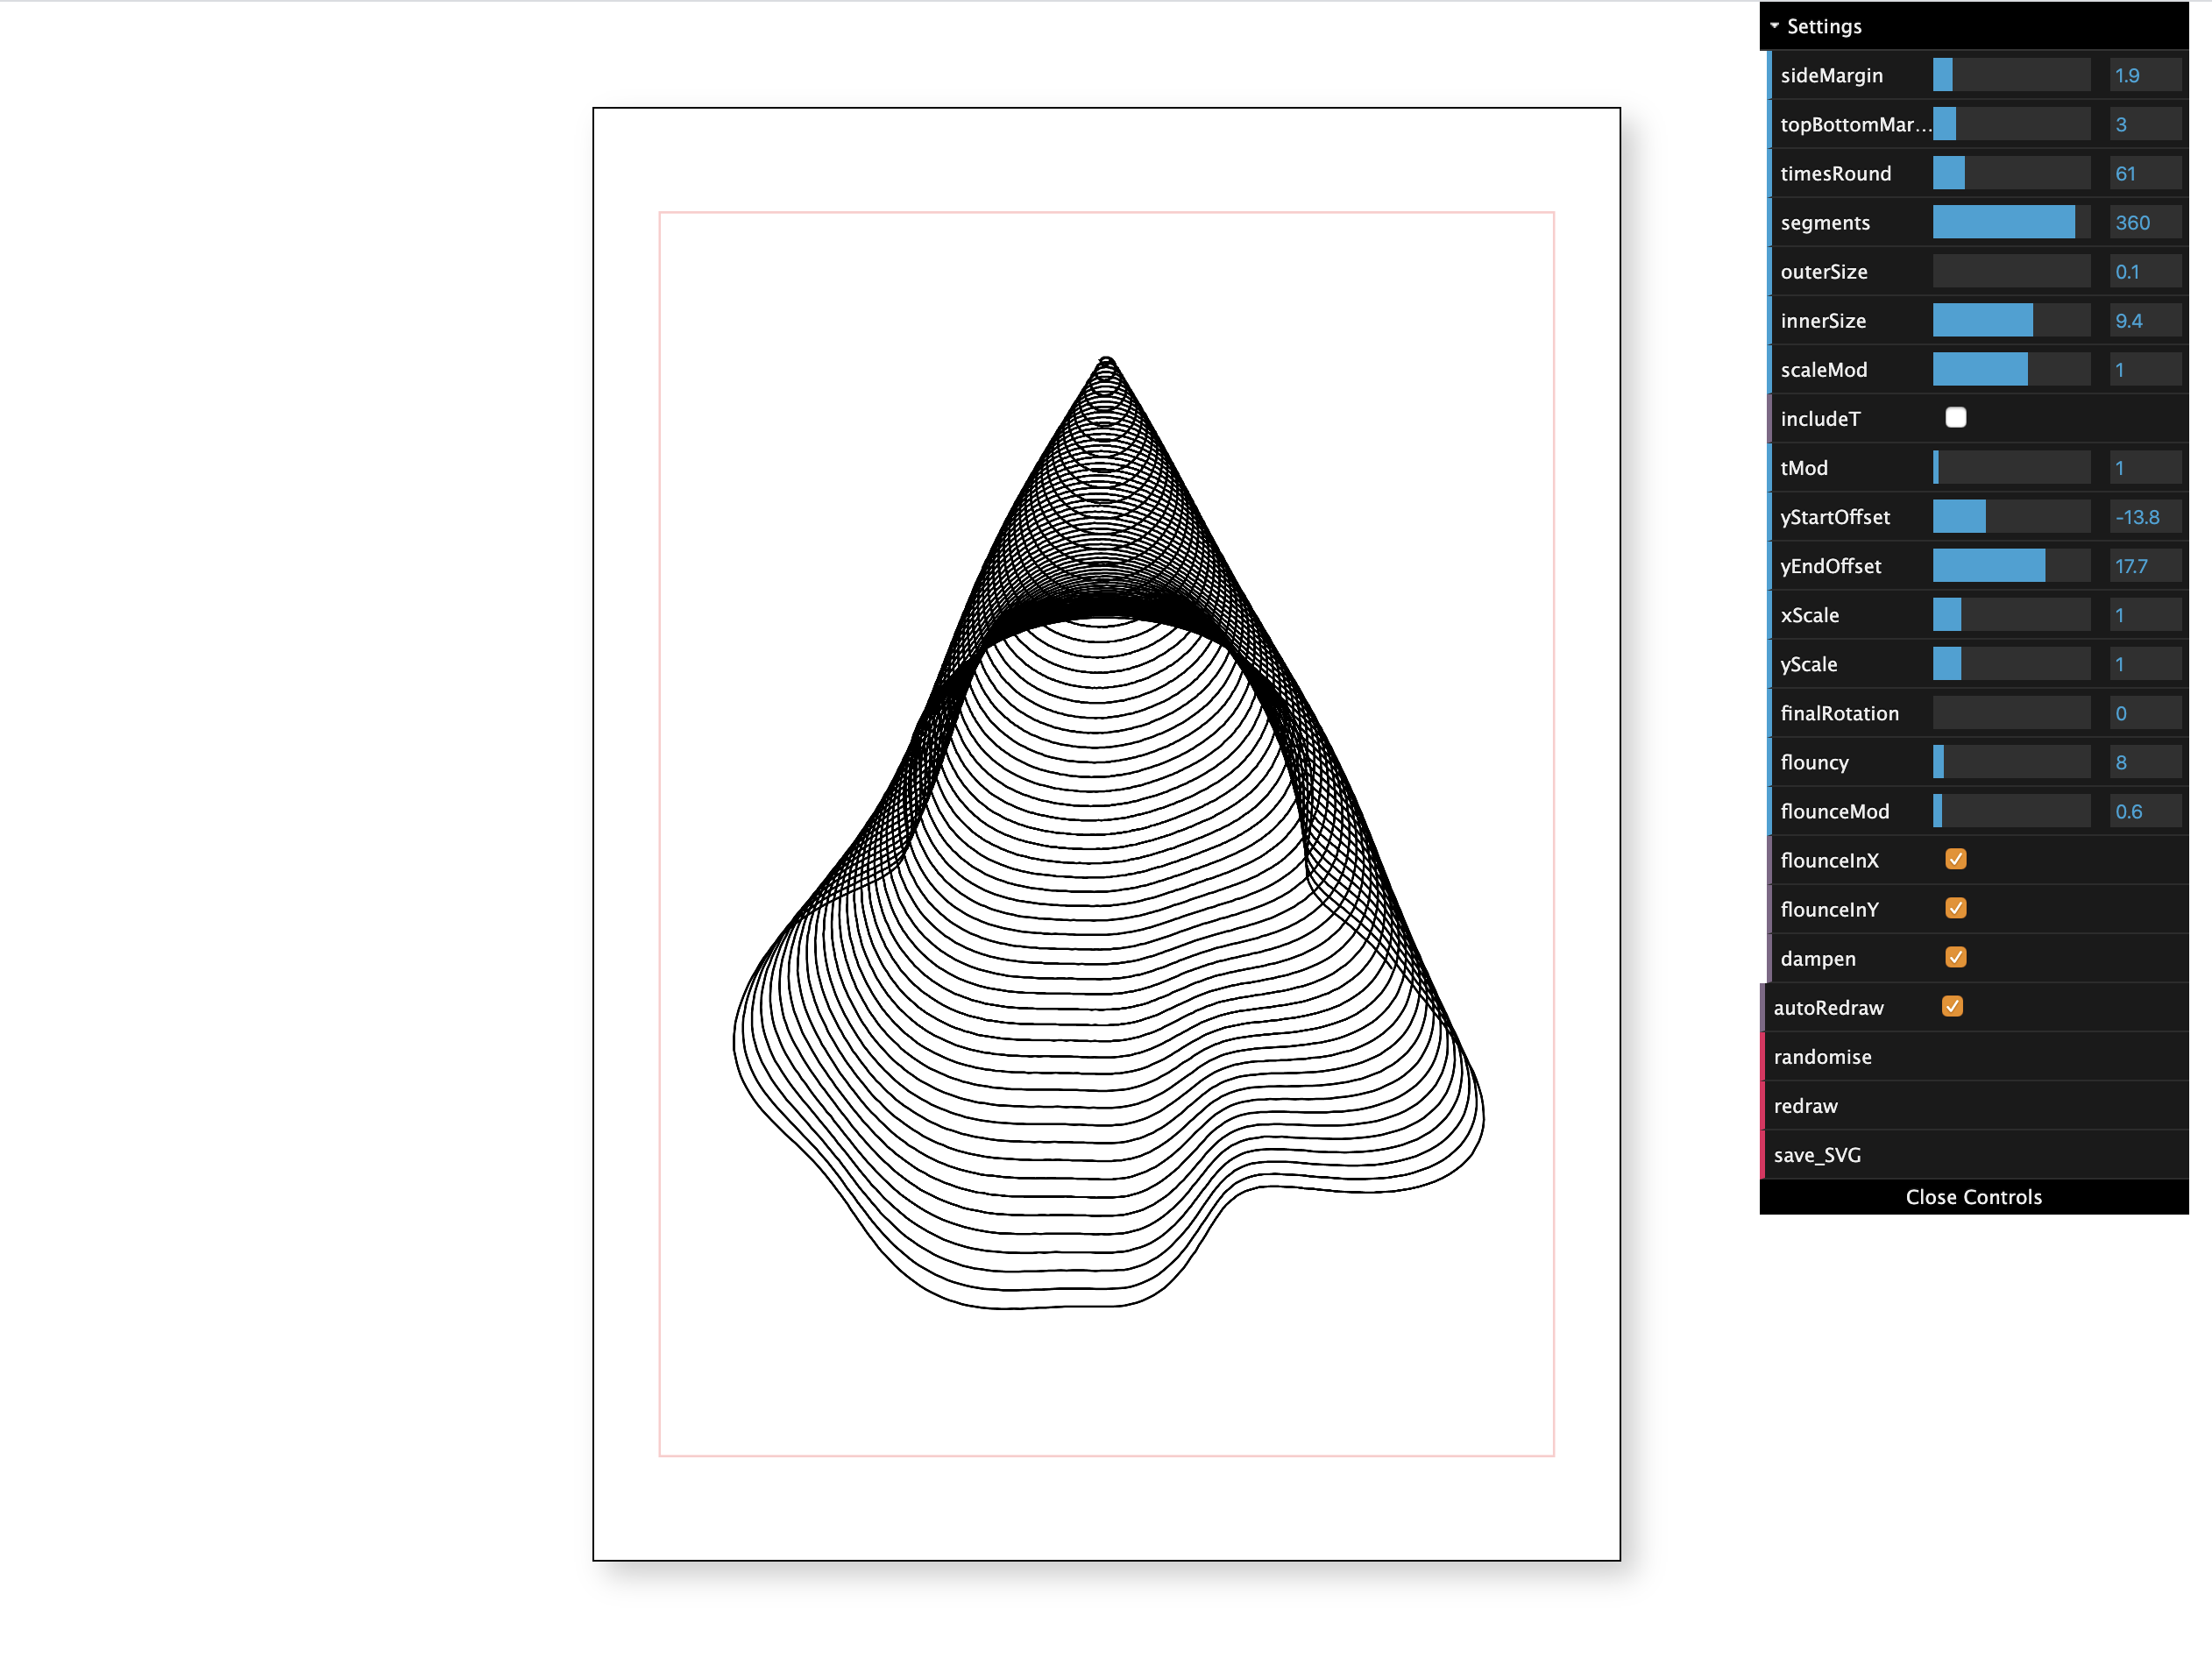
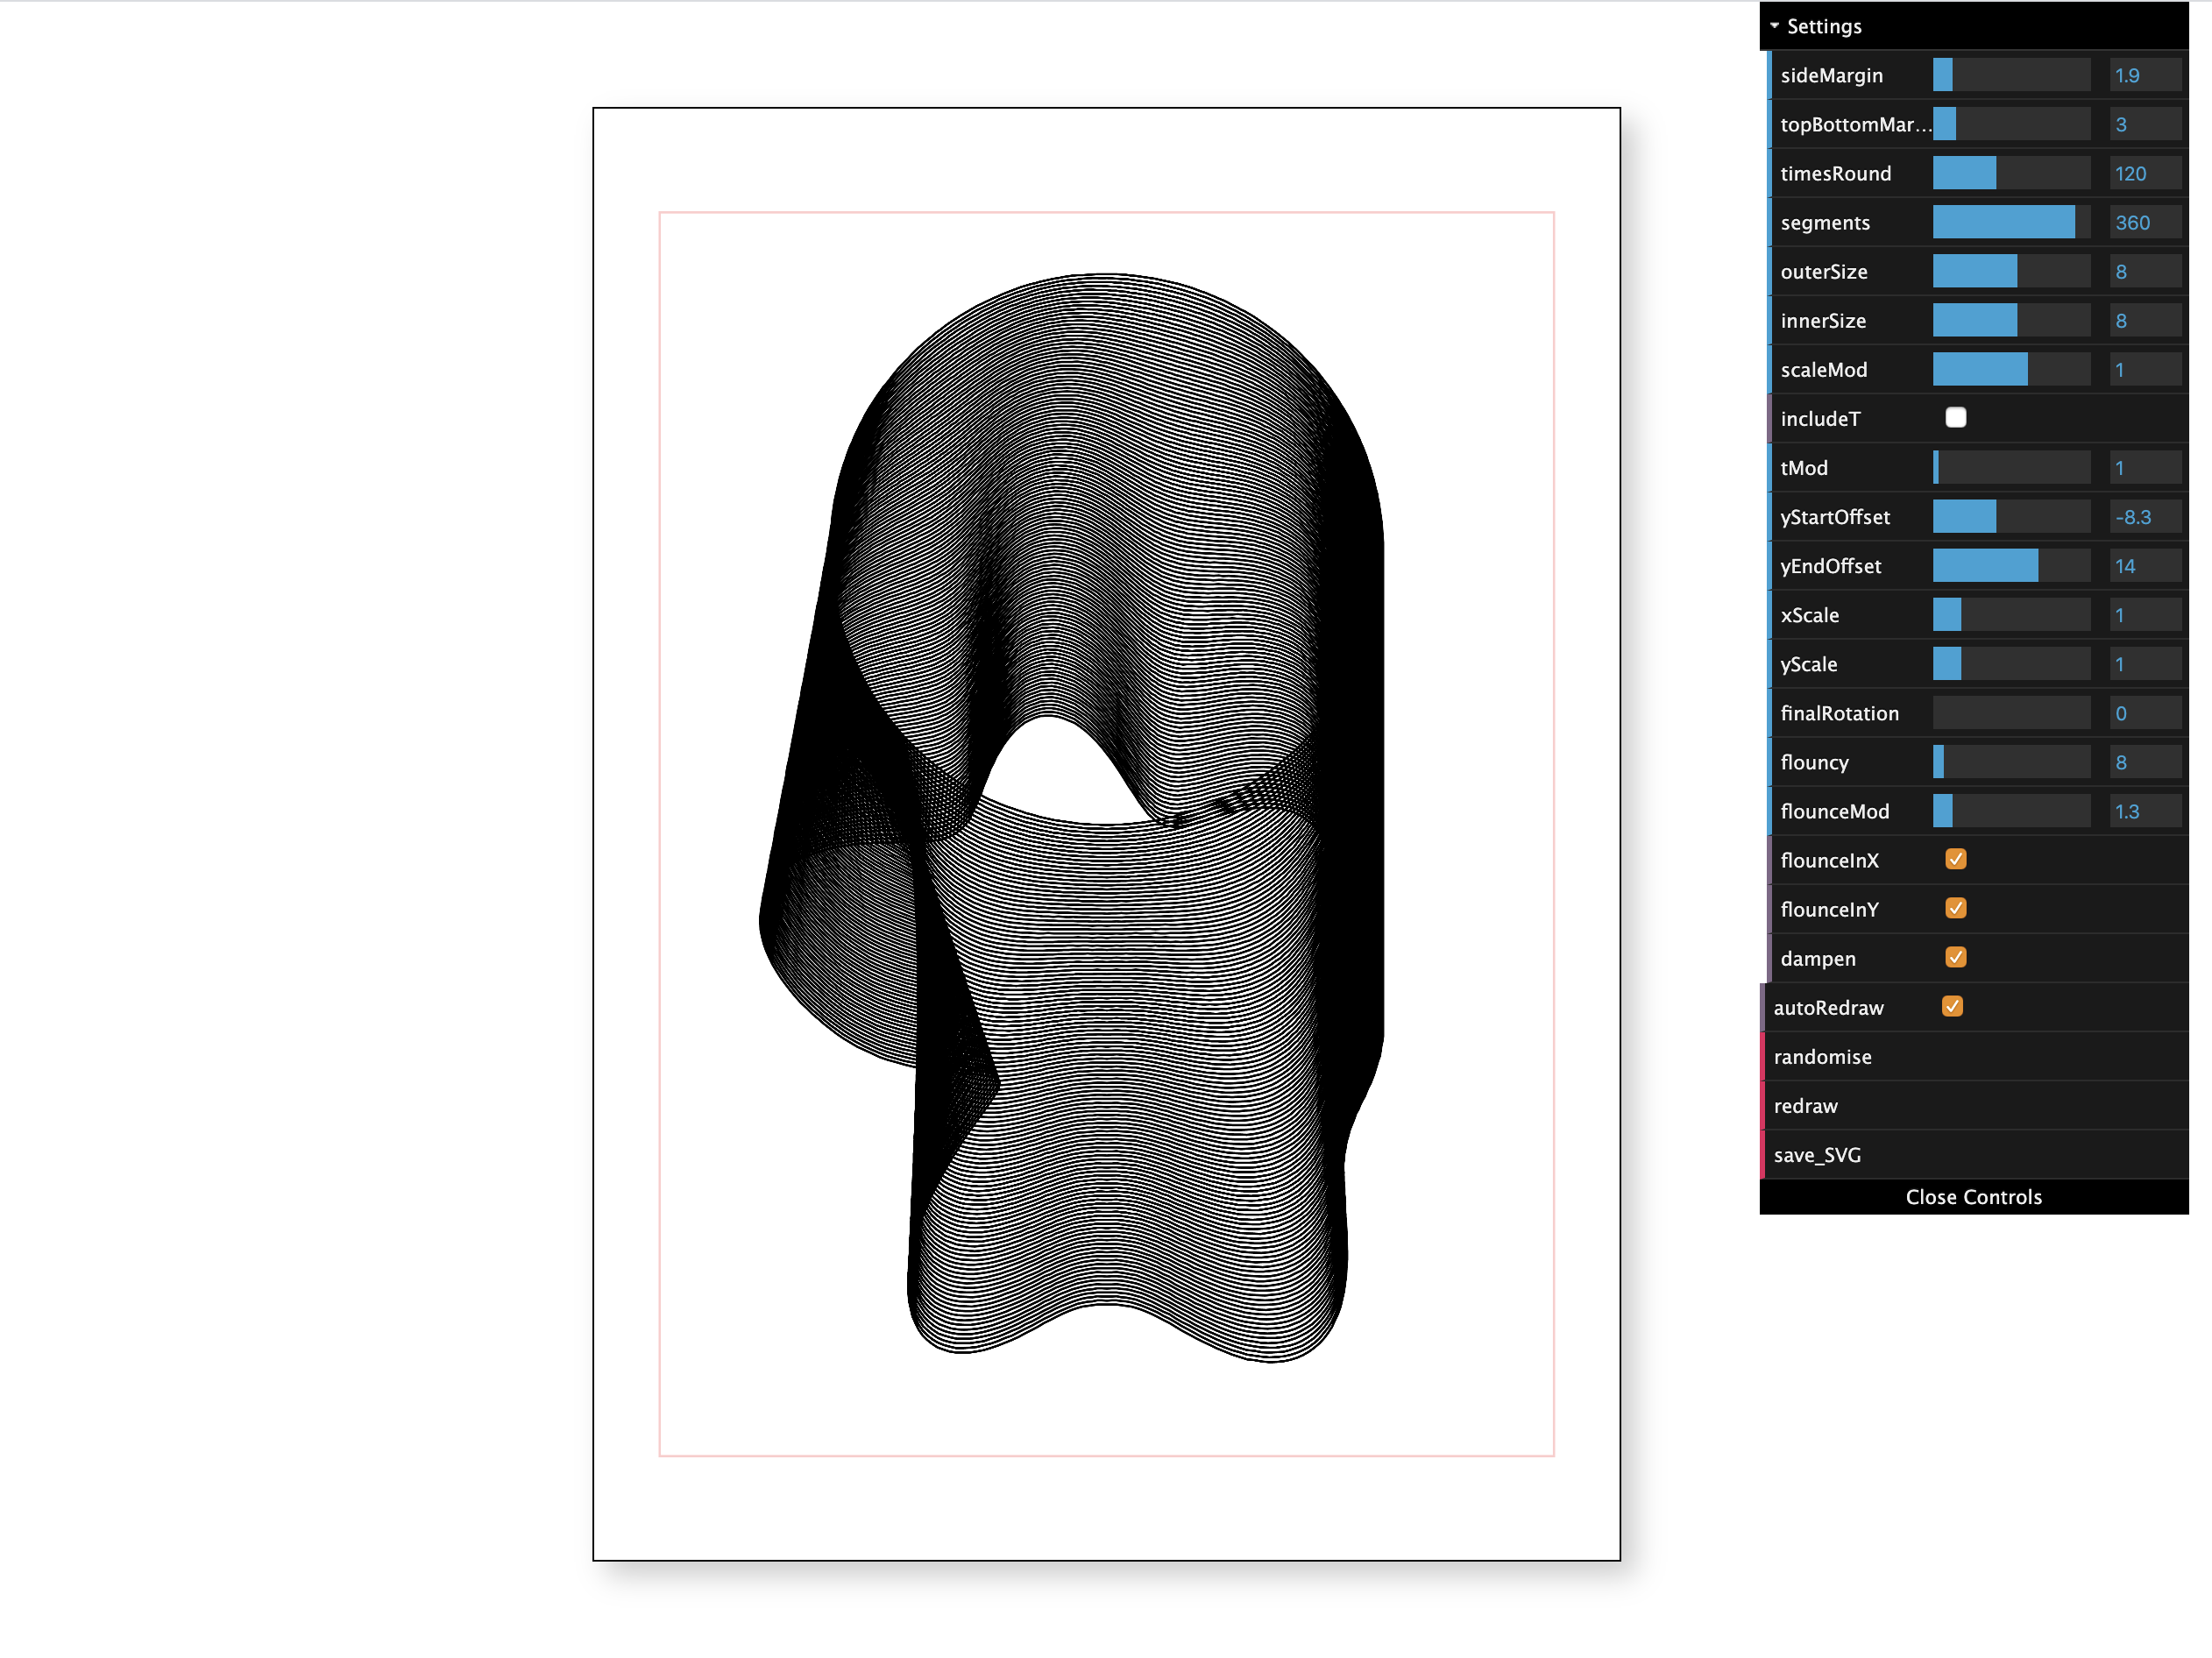
So I wrote some code to allow me to do that, the code running looks something like this (Warning: Javascript heavy page that doesn't work on mobile).
Then I started messing around with offsetting the start and endpoints of the circles, which gave me this
And finally, by making the starting and ending circles the same size, I ended up here (click the "randomise" button for more).
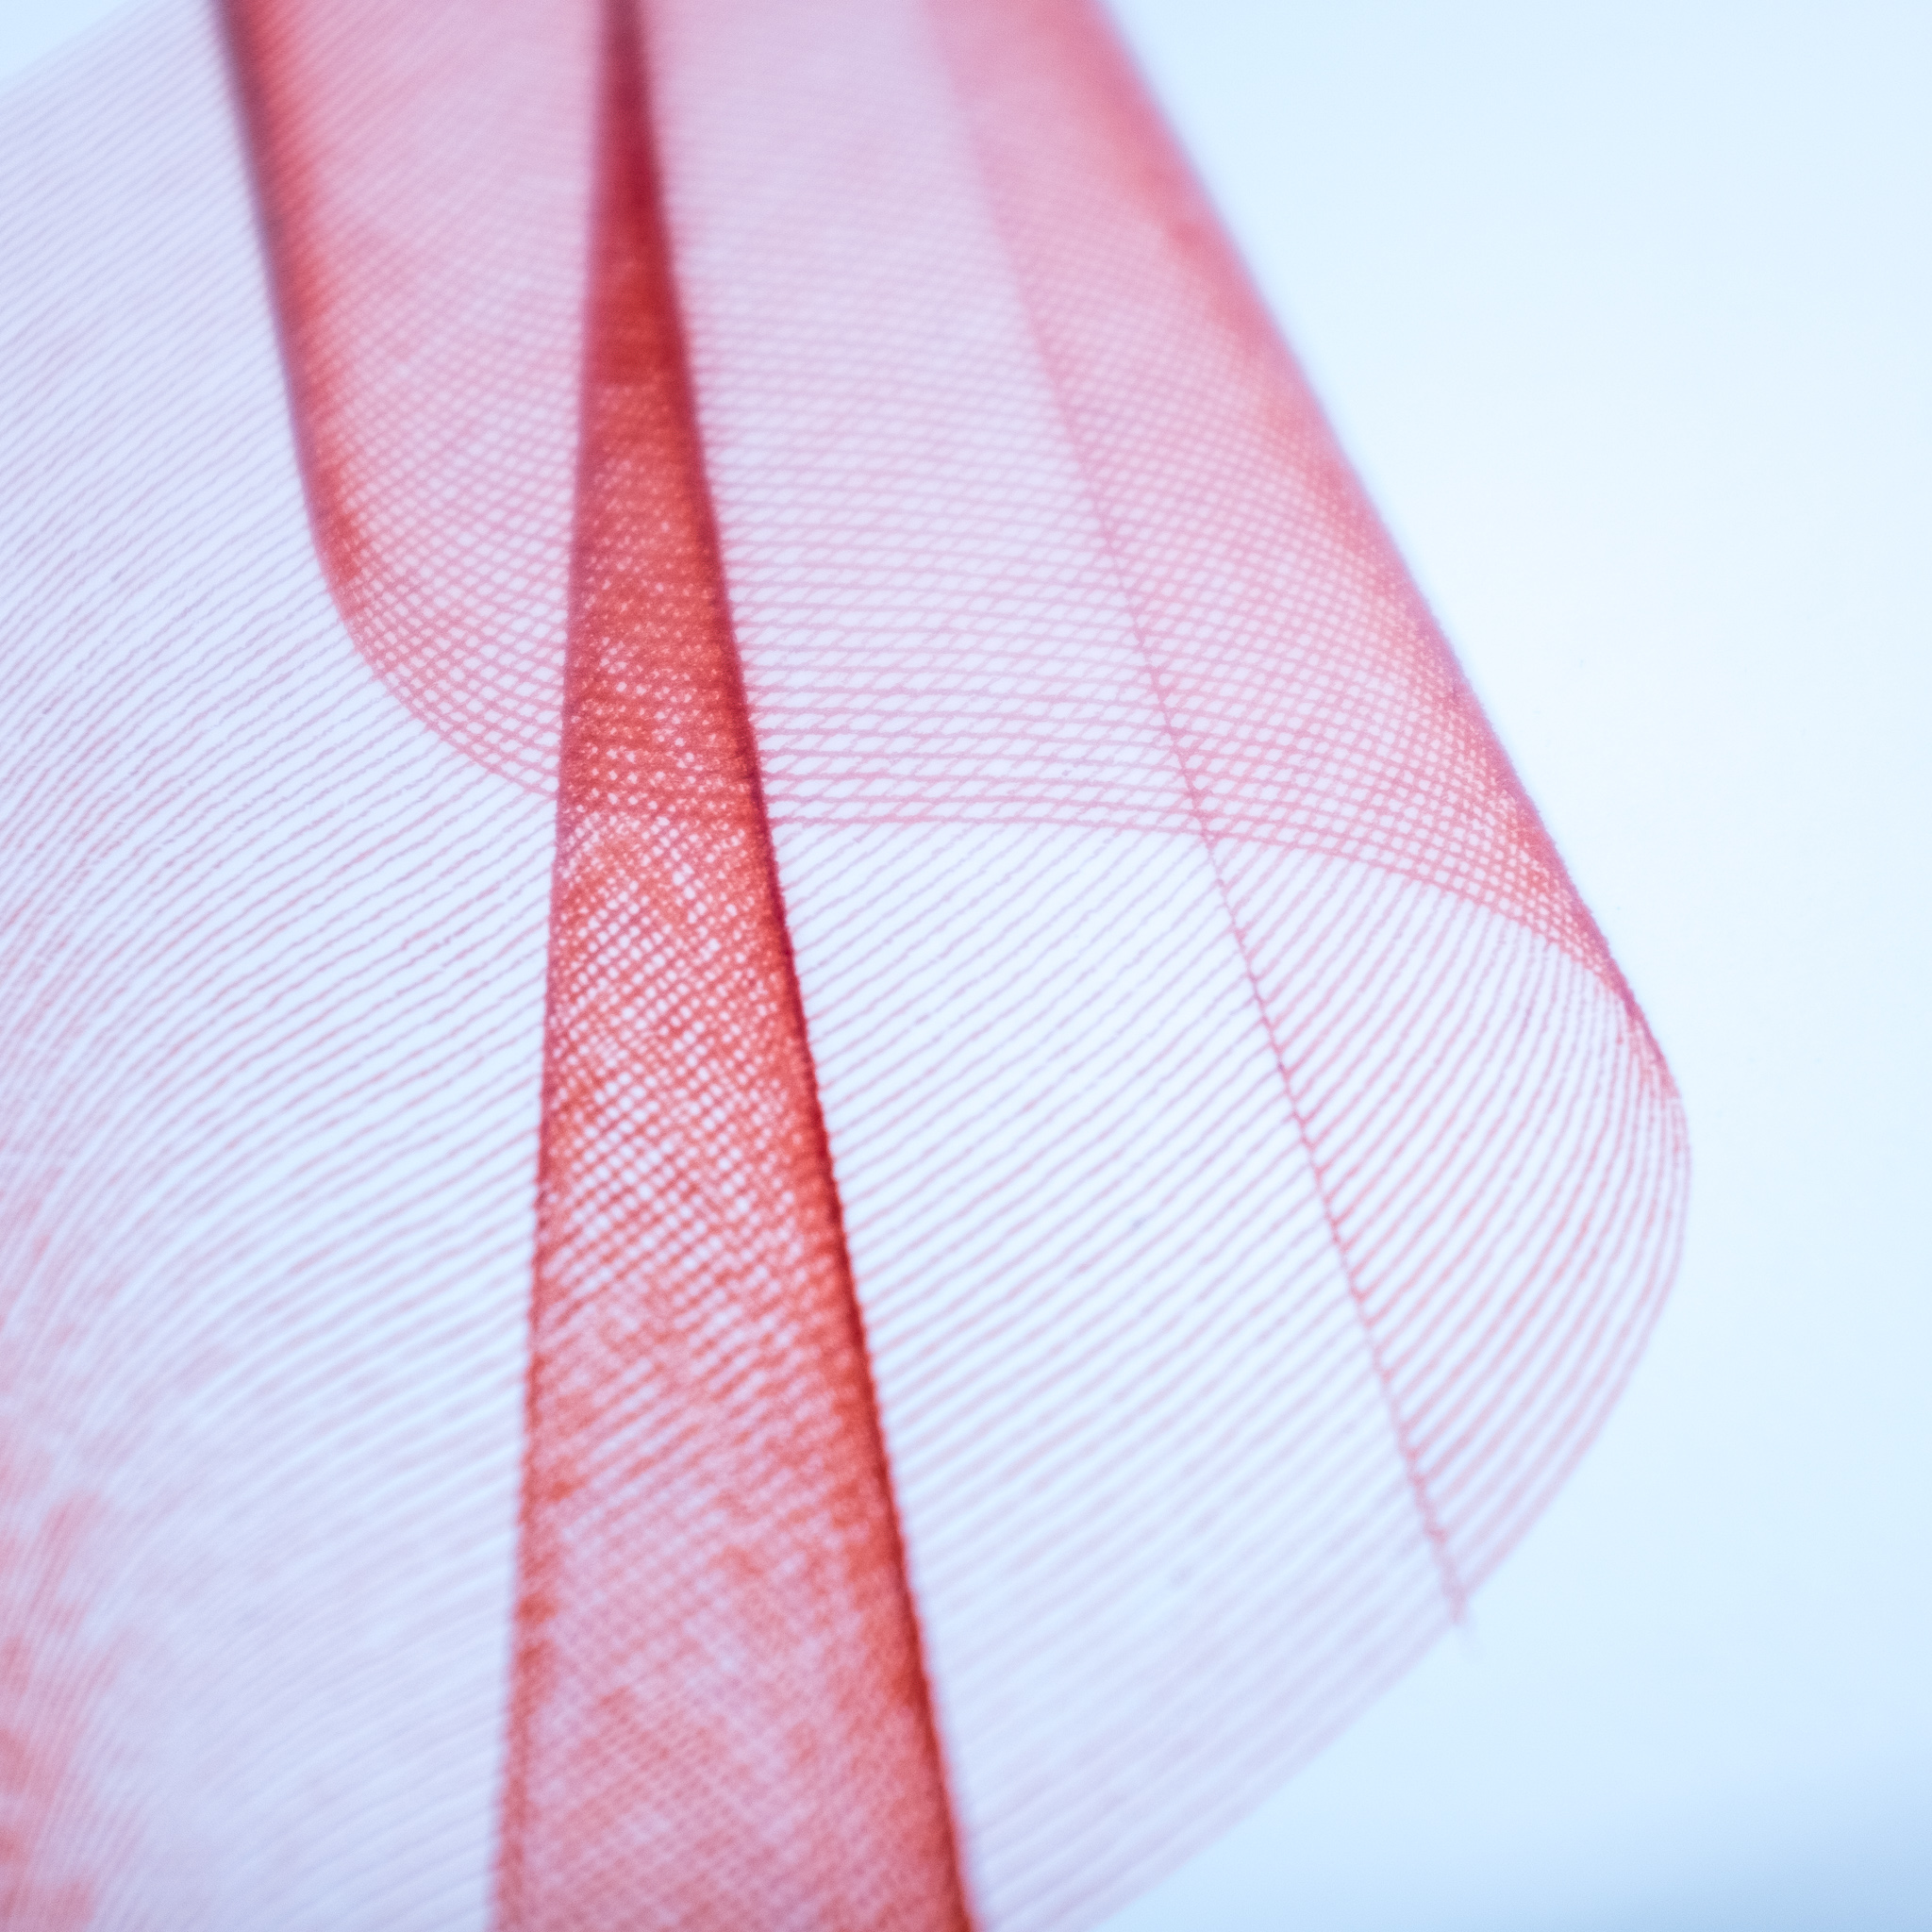
Which is all fine, but when I looked closely at the images, and in some cases not that closely, I could see the seam where the line drawing each circle started and ended.
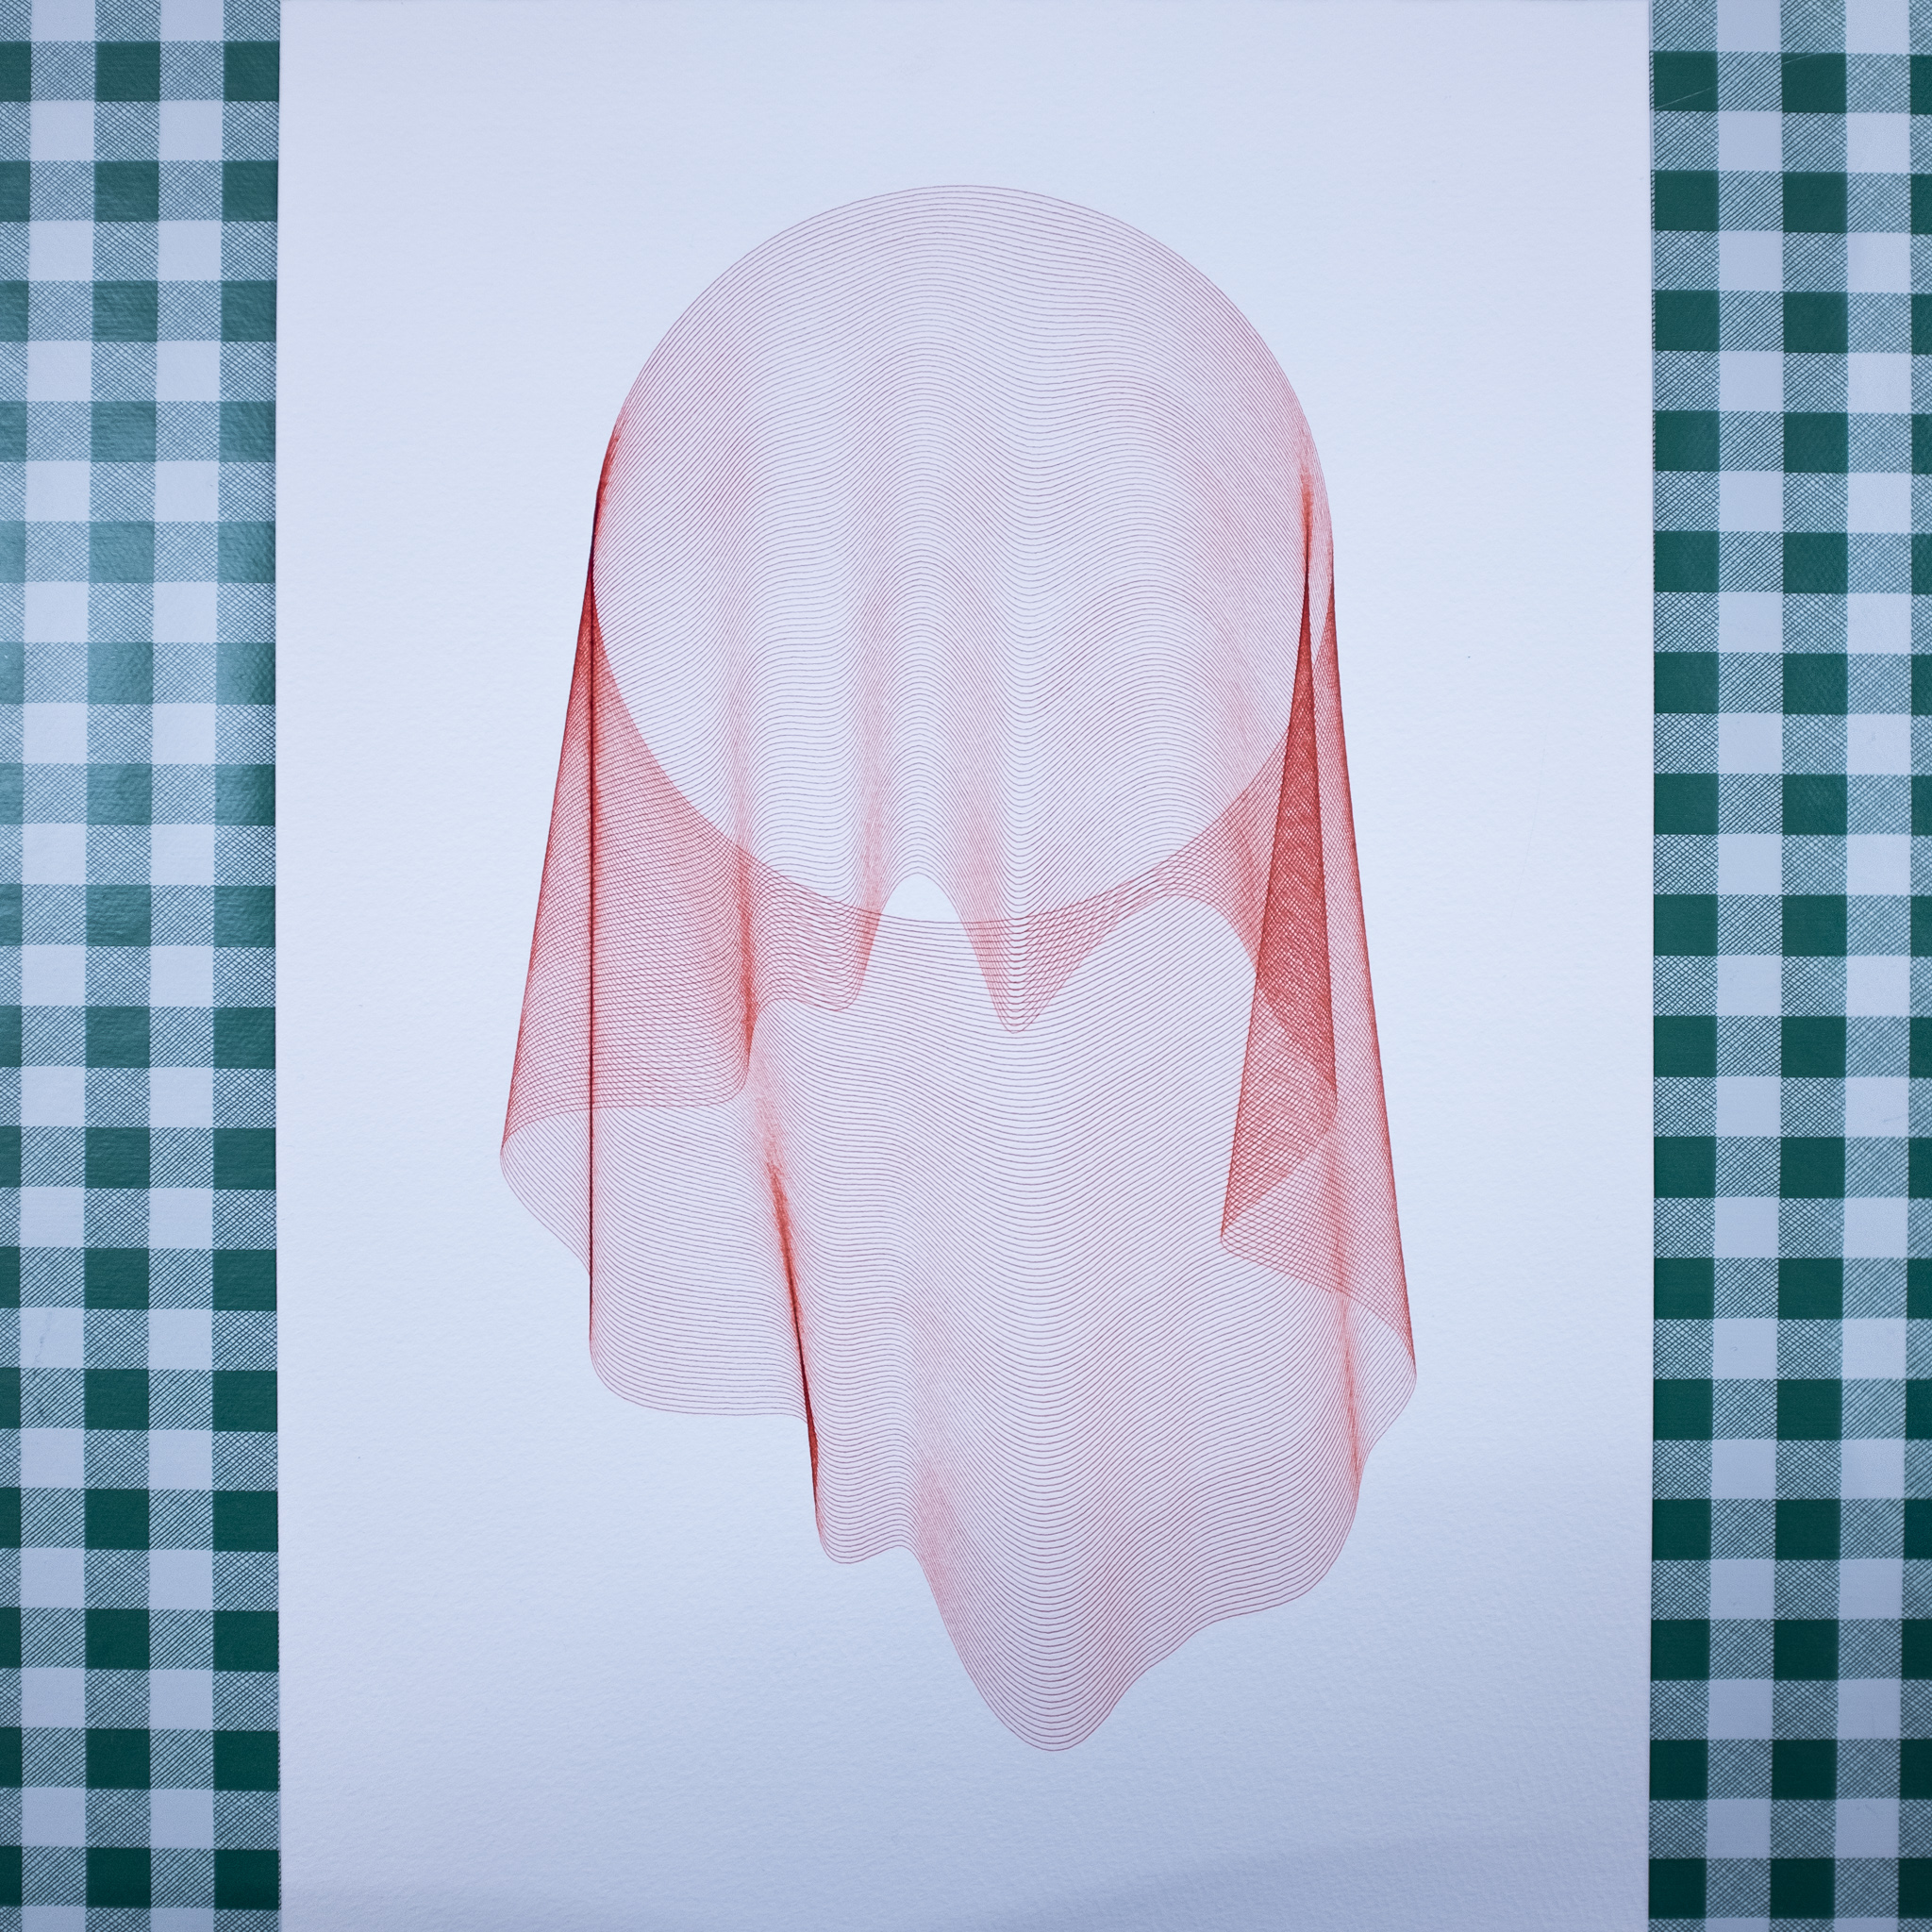
Here you can see the seam on the red, and it's pretty obvious.
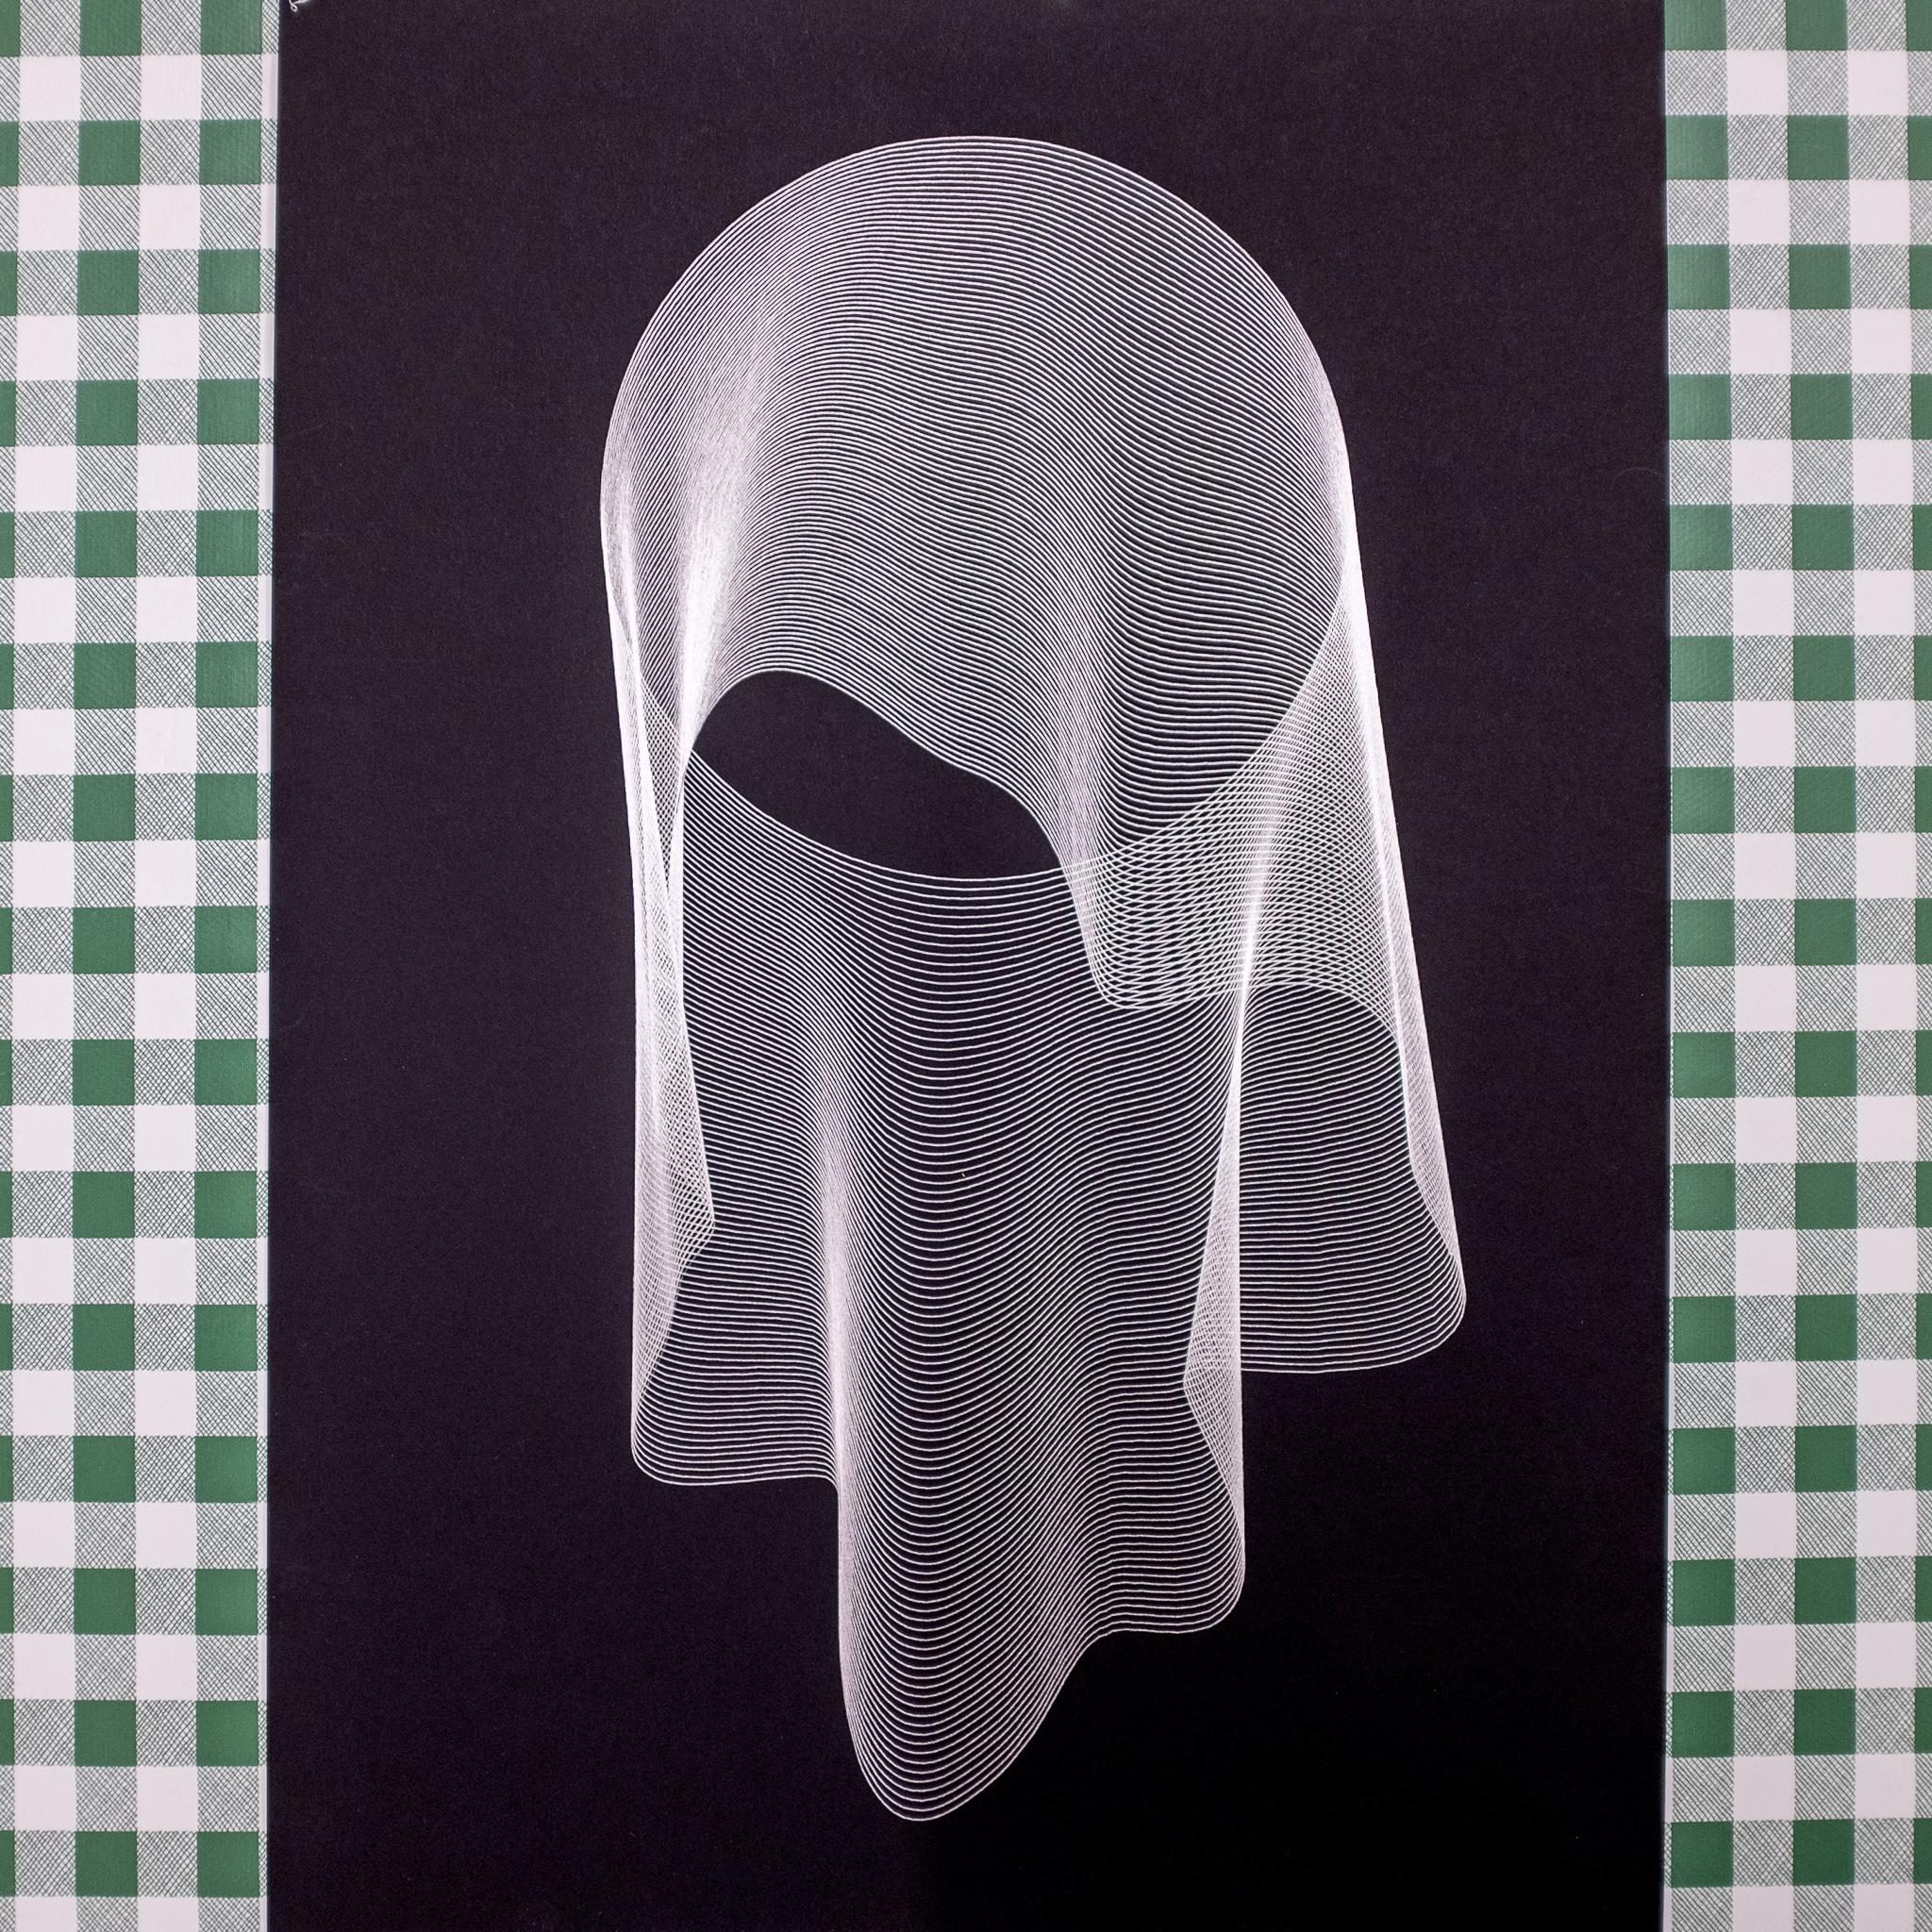
The seam is also there on the overlayed circles.
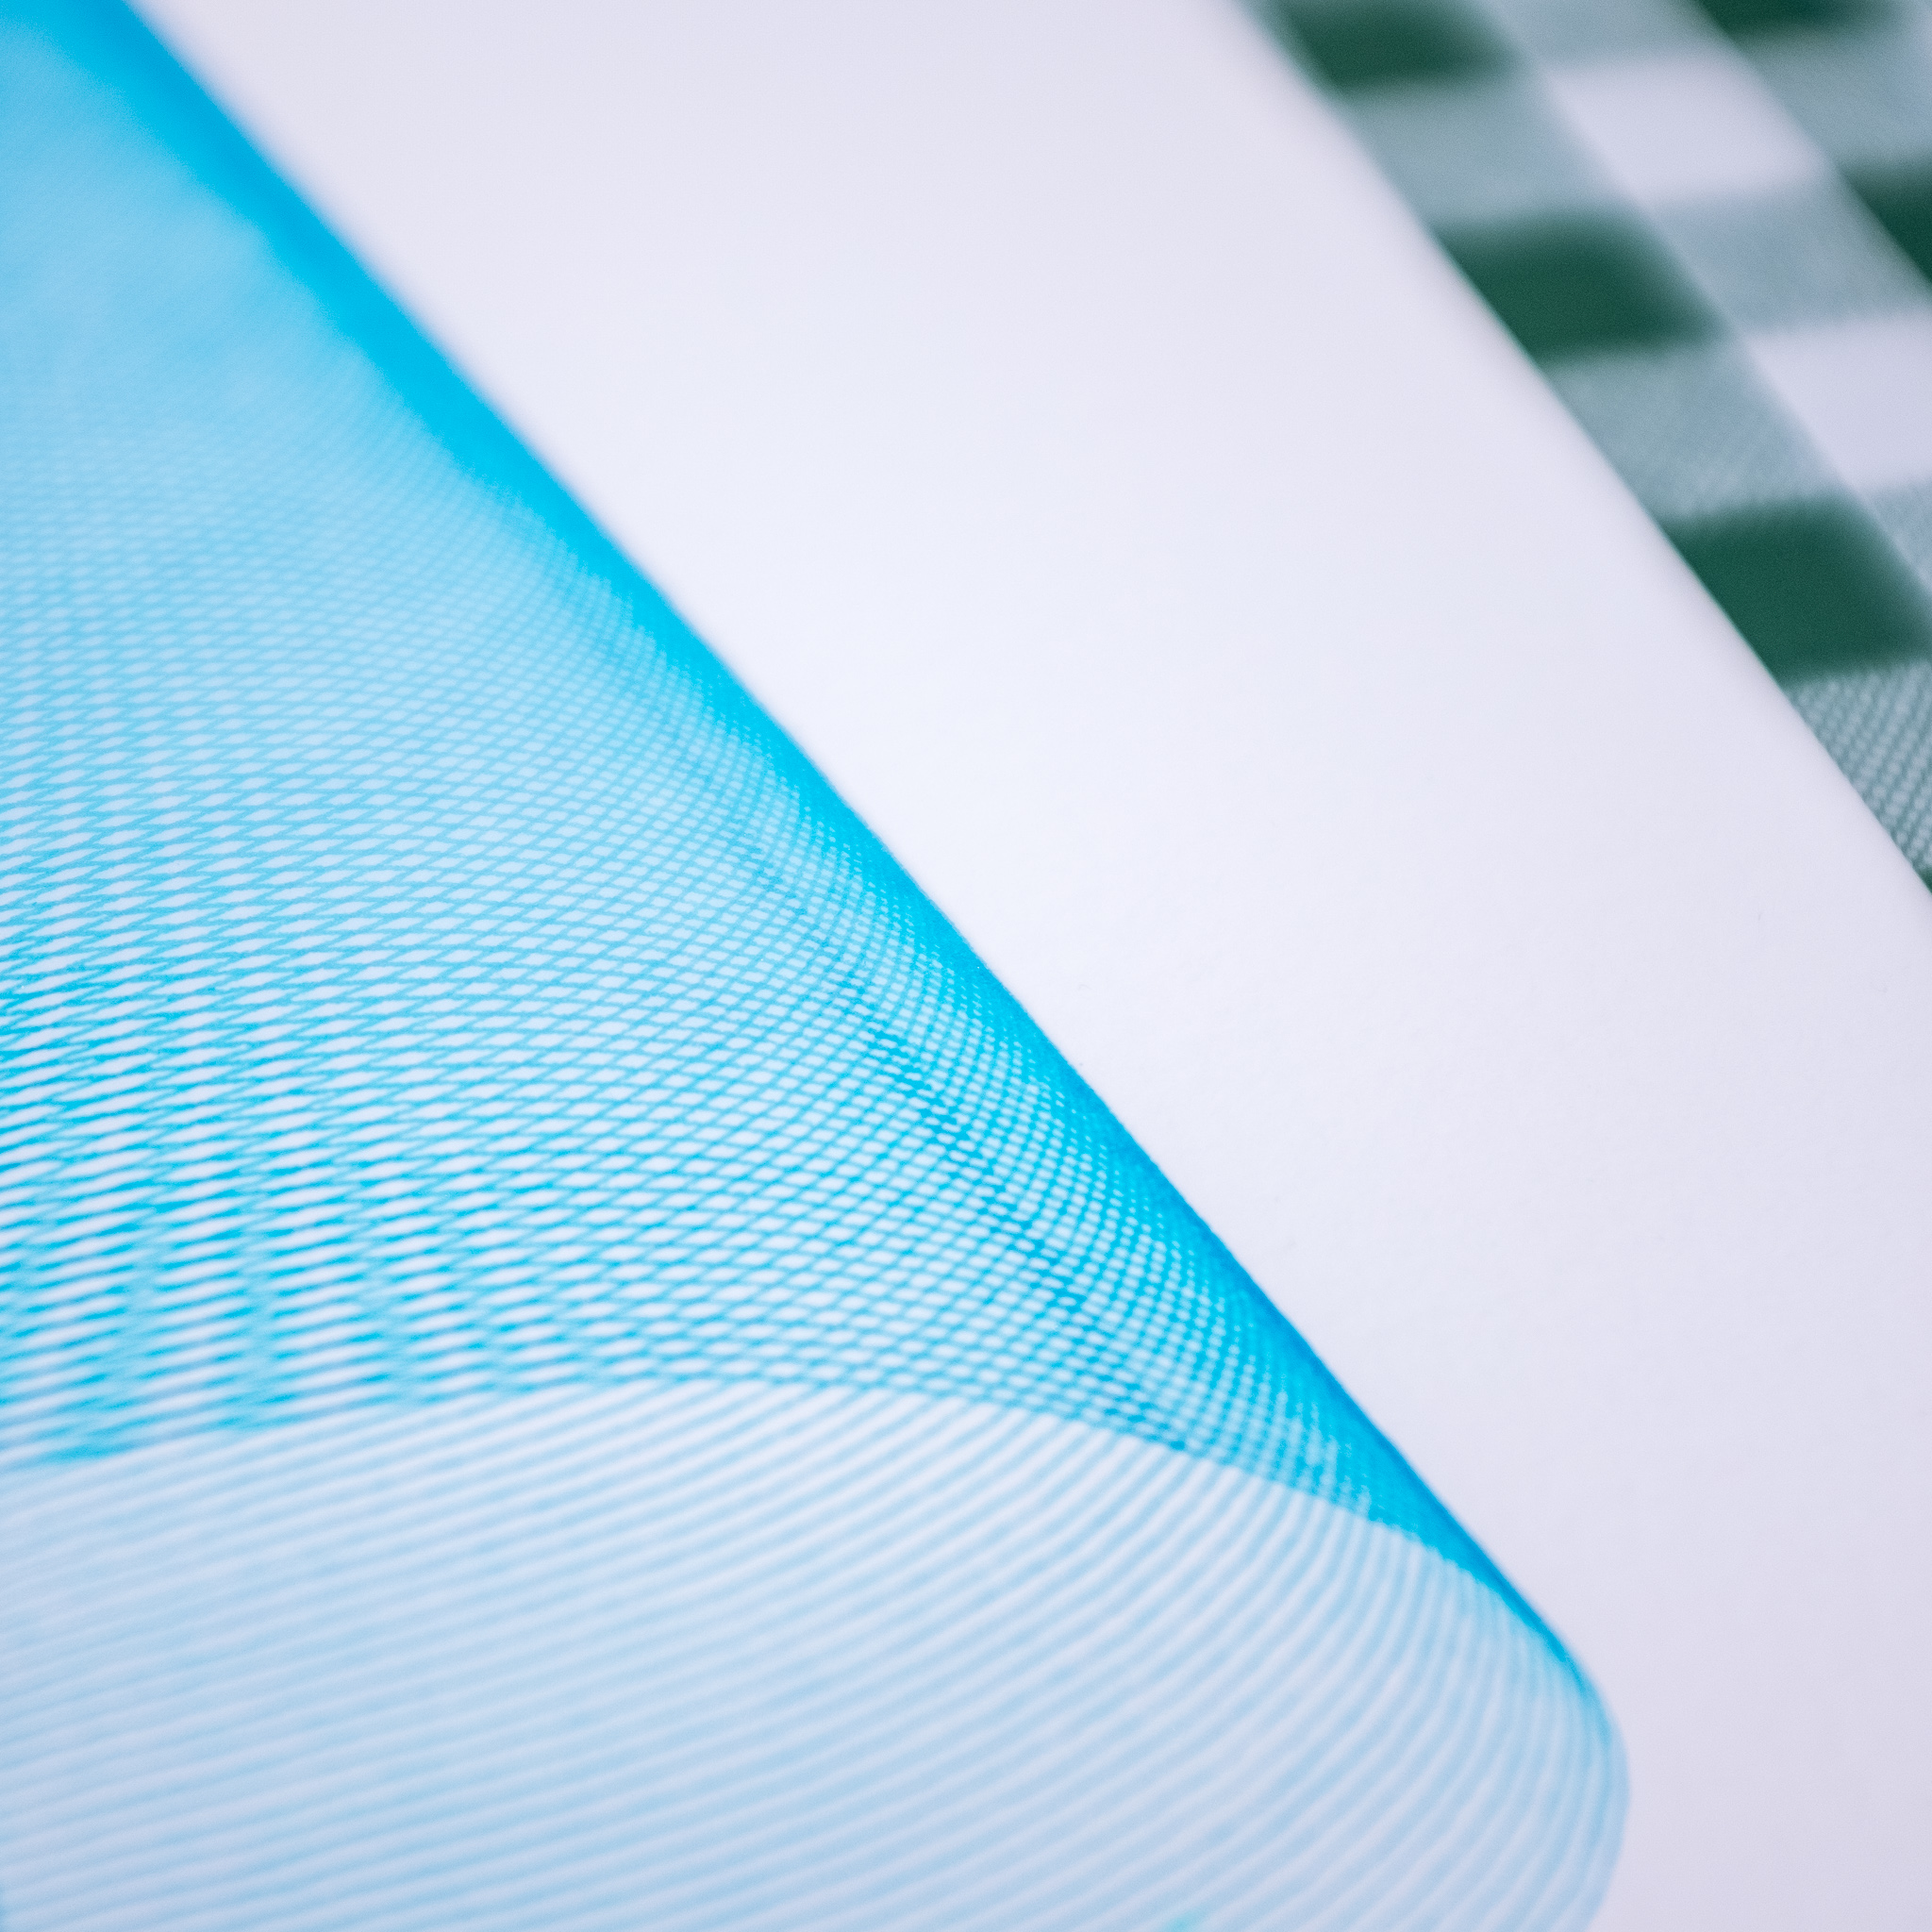
And less noticeable when it vanishes into the design a little bit, as we can see here in the blue. Harder to spot, but still there.
* * *
Solution
There were a few options about how to hide the seam.
The first would be to hide the seam in the design. If I were working with squares, then I could probably stick the start and endpoint in the corner and no-one would notice. No corners in circles so that solution was out.
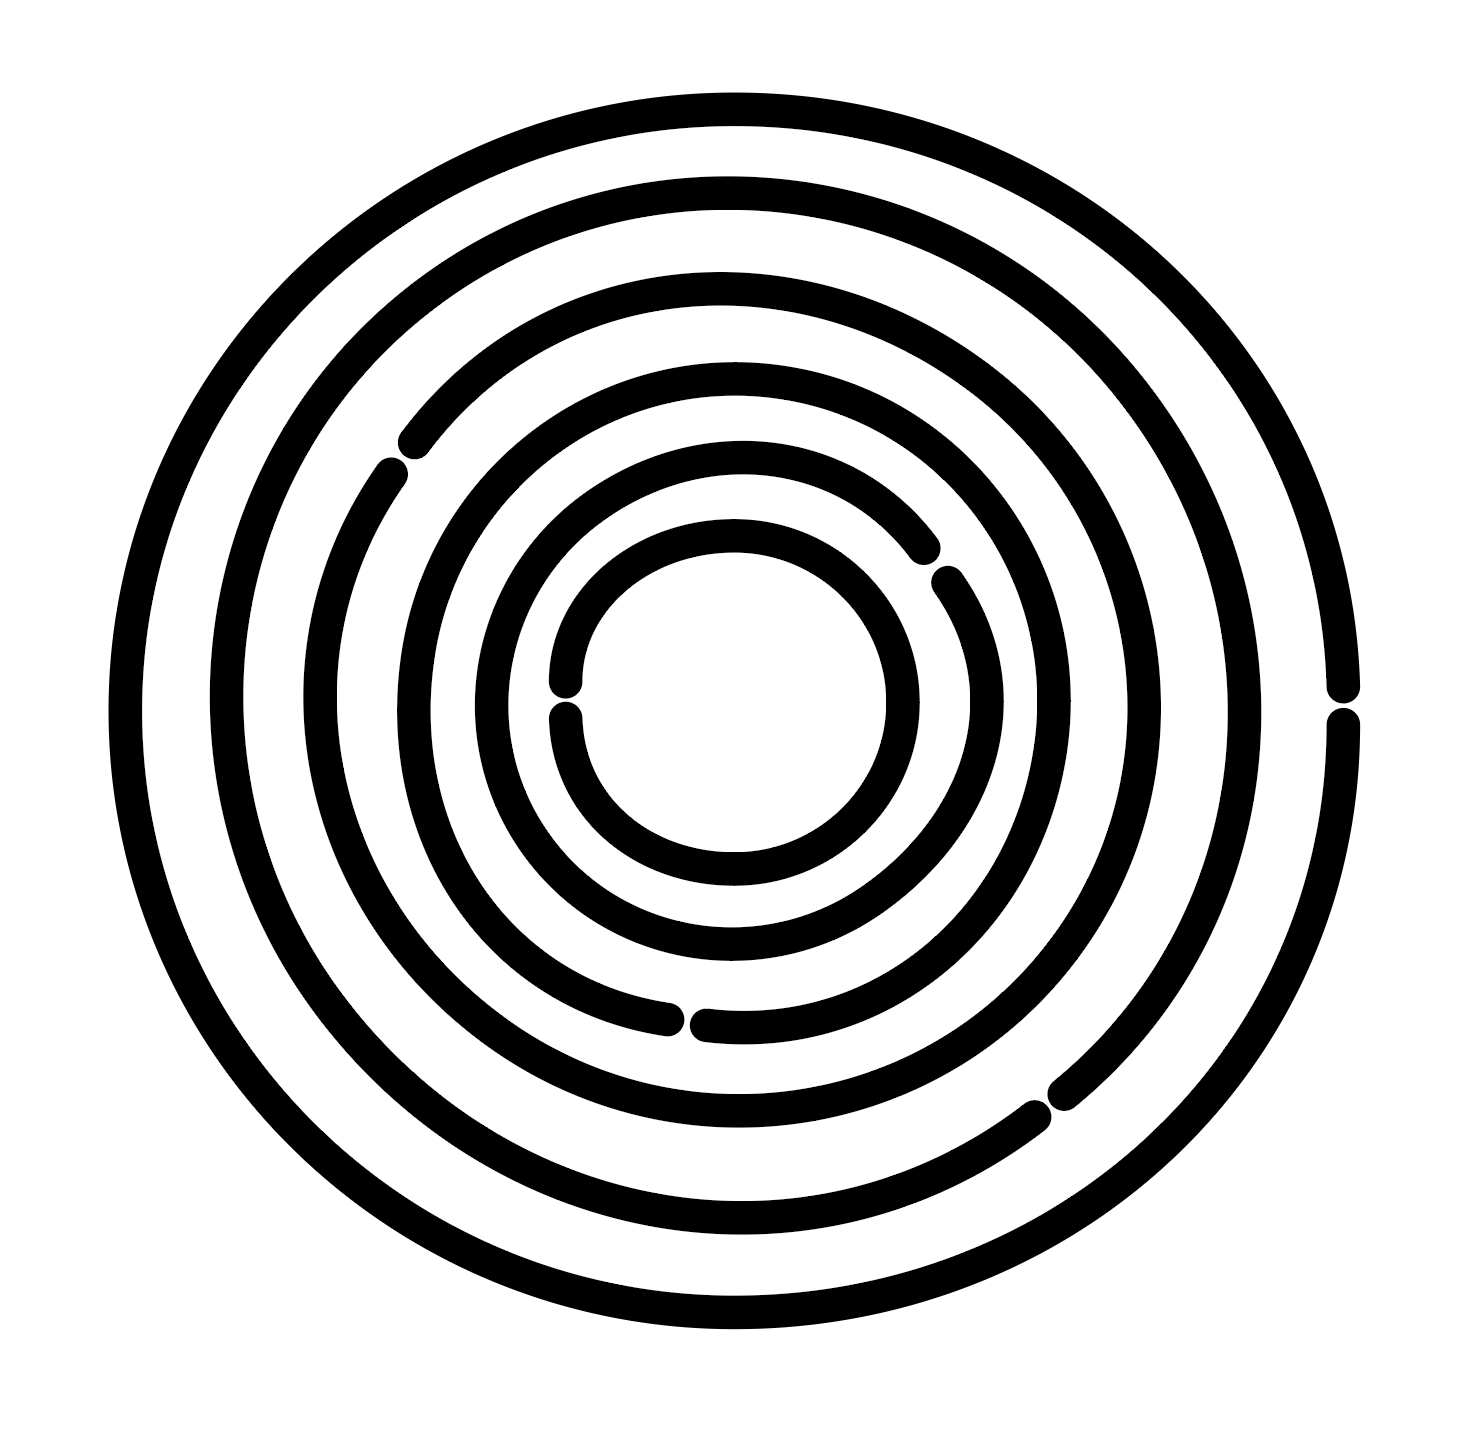
The second would be to make the start/end point be placed randomly somewhere along the line. In each circle, I could either rotate it before it got deformed, or I could close the circle and make a break somewhere else. A bit like the image below on the right.
That's not actually a bad solution, and I may use it when I can't get away with the final solution in the future.
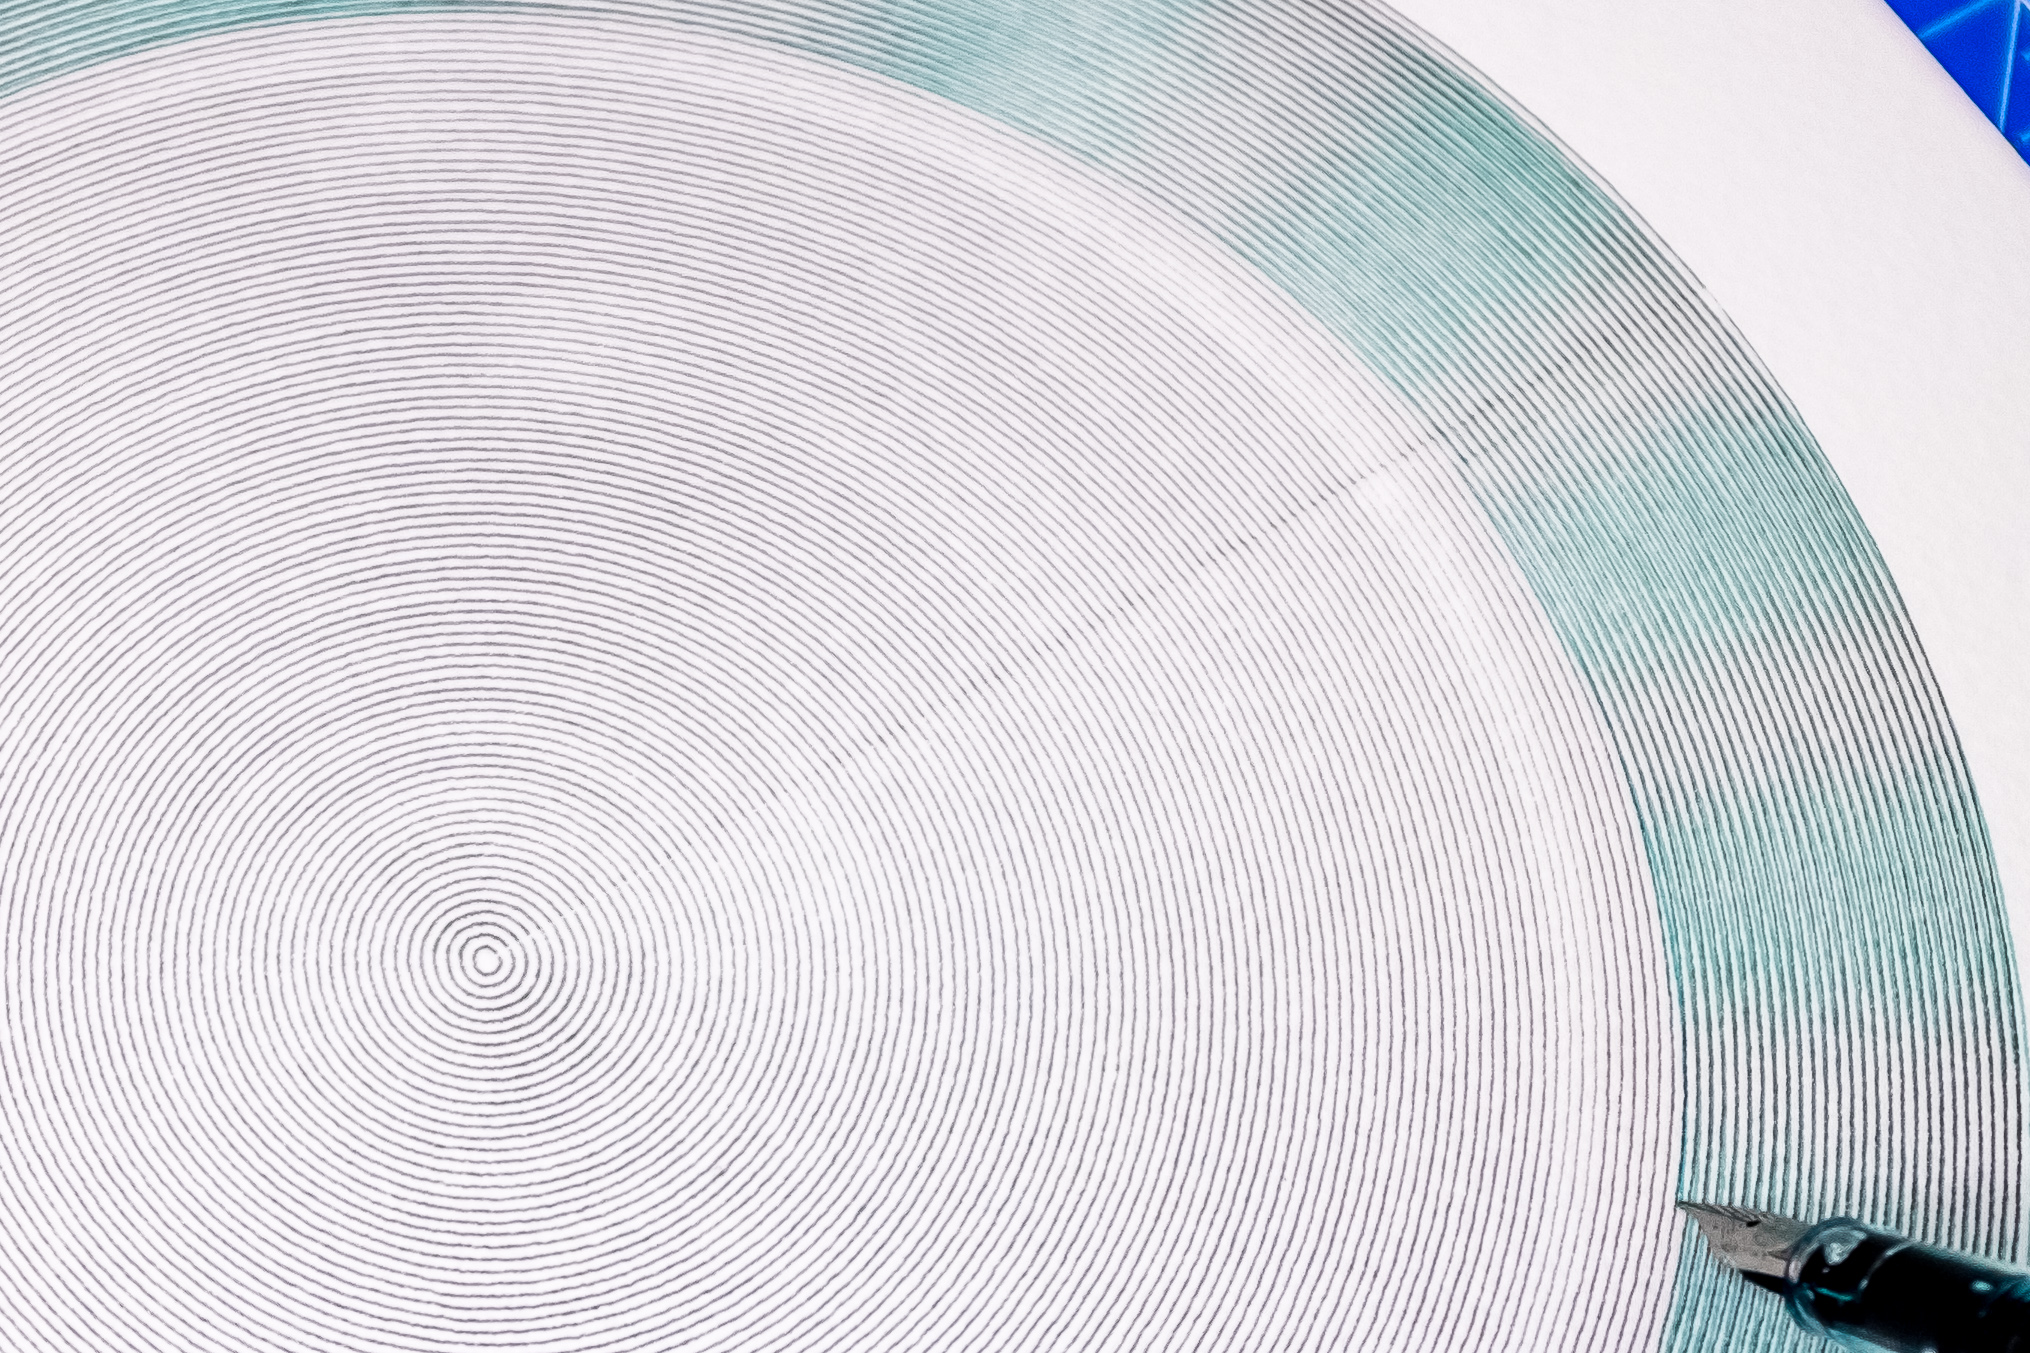
The final solution was to use a spiral instead of concentric circles. Because the rings were so tightly packed I knew there wouldn't be much difference in how the final results looked.
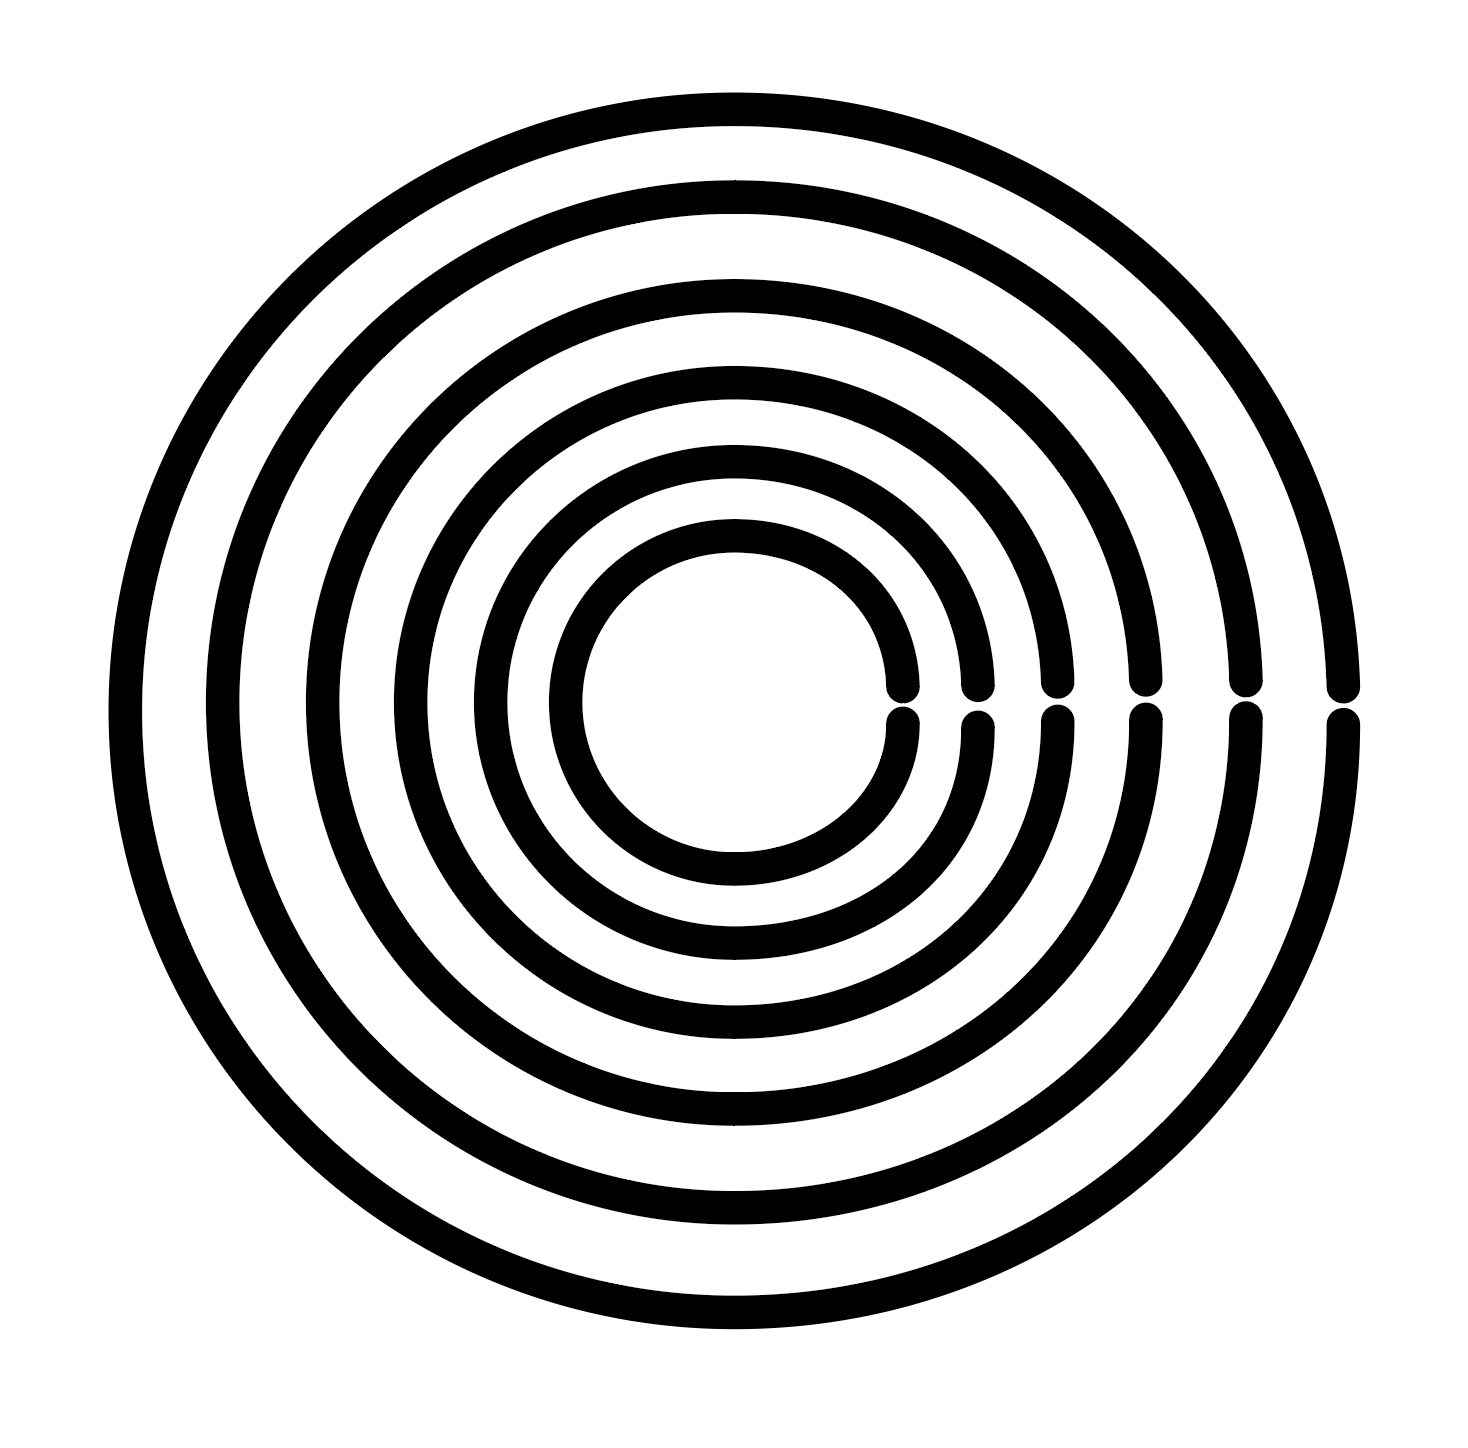
The images below show the spiral on the left and the circles on the right.
Pretty good. Also, it's kinda fun to go "Oh yeah, that's one single continuous line."
Code
A quick note about the code used because sometimes I get asked.
Further up, I posted a couple of links to examples of what I was doing. For example here's another, and another.
To help me quickly-ish create new plots, I wrote a pretty dirty bit of code called "page.js" that handles allowing me to draw lines on a canvas object and convert those lines to an SVG file. Plus a whole bunch of little utility functions to handle scaling, clipping (terrible), rotating and such like. And another called "values.js" which deals with all the url, filename and value handling stuff, along with the dat.GUI library.
Each "sketch" is then a javascript file, which has a bunch of common code at the start and end, then right in the middle, I write my code that actually does the drawing.
Each time I create a new "sketch" I make a new javascript file in a new folder, delete the middle bit of code and write some new code.
This sketch is "021-Perlin-Spiral", the twenty-first one, which means at some point I have to write about the other twenty sketches!
Even though I can make links to sketches, with various parameters passed in, the results are still random within those parameters. Also, when you save the SVG, it sticks all the parameters into the filename to make it easier to track what plot came from which settings.
Using my code yourself would be a terrible idea, as some (i.e. most) of it is somewhat convoluted.
So the quick answer to the question of "what are these done in?" is javascript, no InkScape, no Illustrator.
* * *
